. 2024 Aug 25;10(1):2365125. doi: 10.1080/20565623.2024.2365125
© 2024 The Author(s). Published by Informa UK Limited, trading as Taylor & Francis Group
This is an Open Access article distributed under the terms of the Creative Commons Attribution-NonCommercial License (http://creativecommons.org/licenses/by-nc/4.0/), which permits unrestricted non-commercial use, distribution, and reproduction in any medium, provided the original work is properly cited. The terms on which this article has been published allow the posting of the Accepted Manuscript in a repository by the author(s) or with their consent.
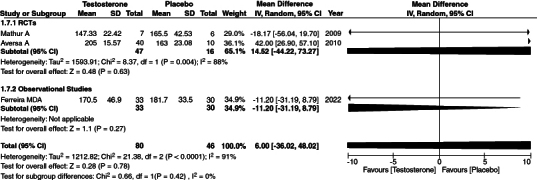
Figure 5.

Forest plot of total cholesterol.
