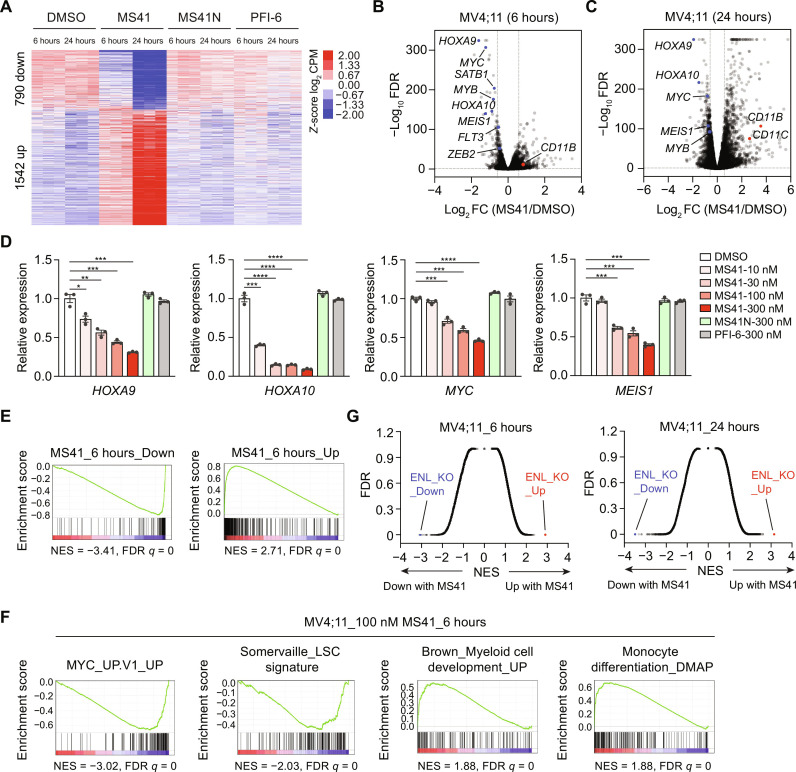
Fig. 4. MS41 suppresses ENL-dependent oncogenic gene expression programs.
(A) Heatmap representation of DEGs from MS41 versus DMSO-treated MV4;11 cells. n = 3 biological replicates. CPM, counts per million. (B and C) Volcano plots of all expressed genes in MV4;11 cells after MS41 treatment for 6 hours (B) and 24 hours (C). The x axis is log2 fold change (log2 FC) of CPM values from MS41 versus DMSO. The y axis is −log10 transformed FDR values for each gene. Key down genes are highlighted in blue and up genes in red. (D) RT-qPCR analysis showing mRNA expression levels of selected ENL target genes in MV4;11 cells treated with DMSO or the indicated concentrations of MS41, MS41N, or PFI-6 for 24 hours. Error bars represent means ± SEM from three independent experiments. Student’s t test, *P < 0.05, **P < 0.01, ***P < 0.001, ****P < 0.0001. (E) GSEA plots with ENL KO as ranking list and Down (left) and Up (right) DEGs of 6-hour MS41 treatment as gene sets. NES, normalized enrichment score. (F) GSEA plots with 6-hour MS41 versus DMSO in MV4;11 as ranking list and the selected curated gene sets. (G) X-y plots of GSEA results with 6 or 24 hours MS41 versus DMSO in MV4;11 cells as ranking list and human MSigDB C2 as gene sets. X axis is NES values; y axis is corresponding FDR values.

