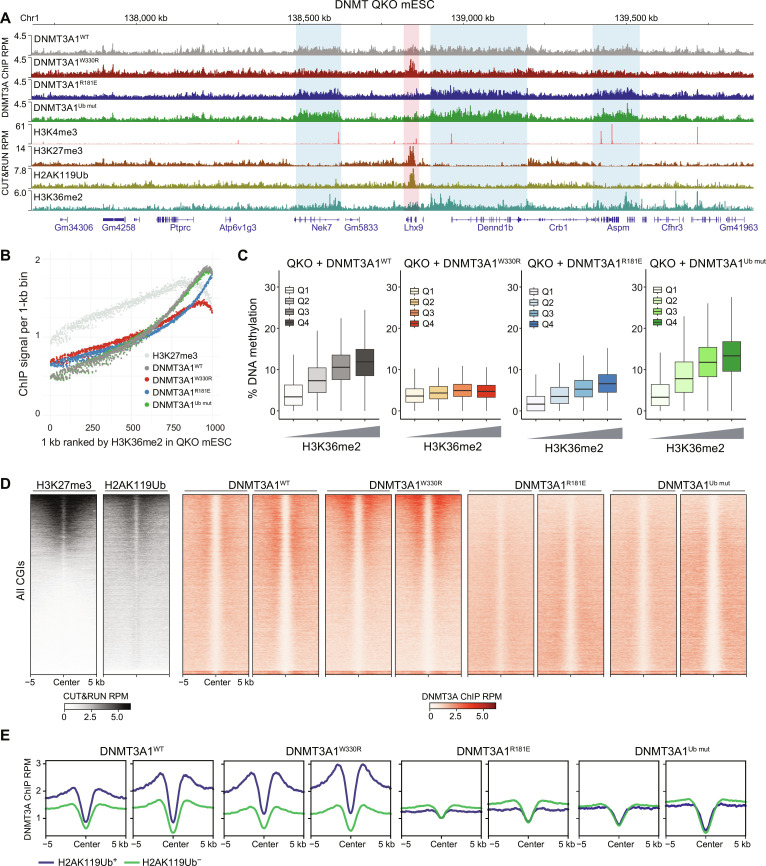
Fig. 3. Genomic targeting of DNMT3A1 is regulated by its interface with H2AK119Ub and nucleosome acidic patch.
(A) Genome browser view (at chromosome 1, 137.7 to 139.8 Mb, GRCm38) of DNMT3A1 ChIP-seq reads for DNMT3A1WT, DNMT3A1W330R, DNMT3A1R181E, and DNMT3A1Ub mut QKO mESCs. CUT&RUN reads for H3K4me3, H3K27me3, H2AK119Ub, and H3K36me2 in DNMT3A1WT QKO mESCs are also shown. Genes from RefSeq database are annotated at the bottom. (B) CUT&RUN reads per 1000 averaged 1-kb bin for H3K27me3 and ChIP-seq reads per 1000 averaged 1-kb bin for DNMT3A1 in DNMT3A1WT, DNMT3A1W330R, DNMT3A1R181E, and DNMT3A1Ub mut QKO mESCs. To generate 1000 rank-ordered bins, 1-kb genomic tiles were ranked by H3K36me2 enrichment in DNMT3A1WT QKO mESC and grouped. (C) Percent of DNAme (EM-seq) in DNMT3A1WT, DNMT3A1W330R, DNMT3A1R181E, and DNMT3A1Ub mut QKO mESCs per 10,000 bins grouped by H3K36me2 CUT&RUN enrichment [Q1 (lowest) to Q4 (highest)]. (D) Enrichment heat map of H3K27me3 and H3K36me2 CUT&RUN reads in DNMT3A1WT QKO mESCs and DNMT3A1 ChIP-seq reads in DNMT3A1WT, DNMT3A1W330R, DNMT3A1R181E, and DNMT3A1Ub mut QKO mESCs sorted by H3K27me3 centered at CGIs ± 5 kb. (E) Enrichment plot of ChIP-seq reads of DNMT3A1 in DNMT3A1WT, DNMT3A1W330R, DNMT3A1R181E, and DNMT3A1Ub mut QKO mESCs centered at CGIs ± 5 kb and grouped into the highest 20% H2AK119Ub-enriched CGIs (H2AK119Ub+) and the lowest 80% H2AK119Ub-enriched CGIs (H2AK119Ub−).

