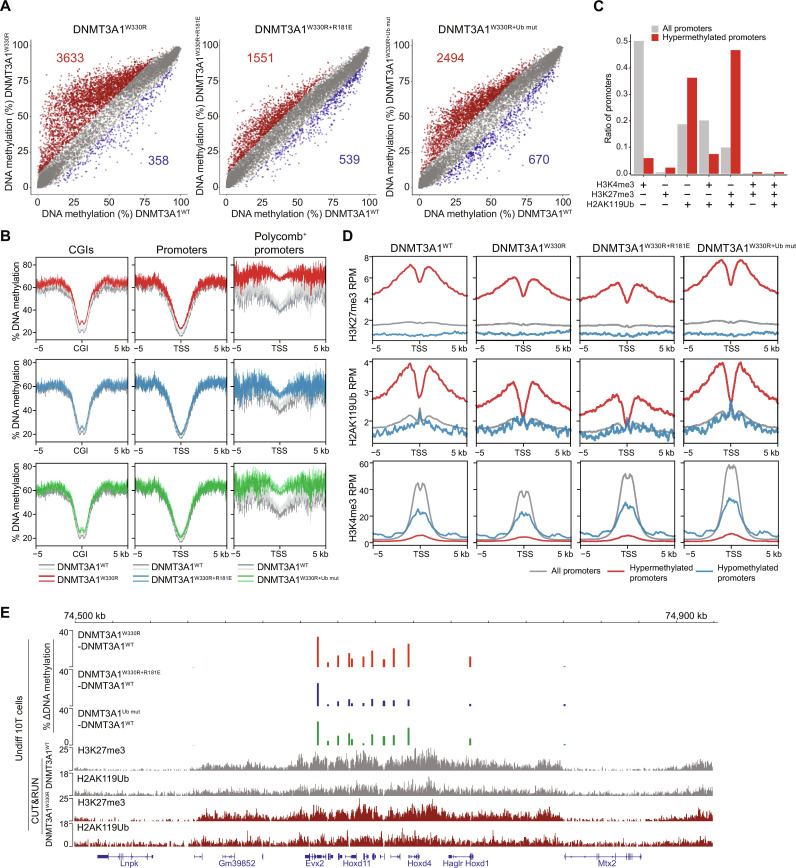
Fig. 4. Polycomb promoter hypermethylation following DNMT3A1 redistribution requires DNMT3A1 interaction with the nucleosome acidic patch and H2AK119Ub.
(A) Scatter plots showing the percentage of DNAme (by RRBS) at promoters [TSS ± 500 base pairs (bp)] in DNMT3A1W330R, DNMT3AW330R+181E, and DNMT3A1W330R+Ub mut versus DNMT3A1WT-expressing 10T cells. Each dot represents a single promoter. Significantly hypermethylated (>10% and q < 0.01) and hypomethylated (<−10% and q < 0.01) promoters are colored in red and blue, respectively (two biological replicates). (B) Metagene plot showing the percentage of DNAme over CGIs ± 5 kb (left), promoters (TSS ± 5 kb) (middle), and Polycomb-regulated promoters (H3K27me3+ and H2AK119Ub+) (right) in DNMT3A1W330R, DNMT3AW330R+R181E, and DNMT3A1W330R+Ub mut compared to DNMT3A1WT 10T cells. (C) Bar plot showing representation among all promoters, or 10T DNMT3AW330R–hypermethylated promoters, for each group of promoters defined by histone PTM status in control cells as in fig. S6B. (D) Metagene plot showing enrichment of H2AK119Ub, H3K27me3, and H3K4me3 CUT&RUN reads from DNMT3A1WT, DNMT3A1W330R, DNMT3AW330R+R181E, and DNMT3A1W330R+Ub mut 10T cells, centered at TSS ± 5 kb, and grouped by all, hypermethylated, and hypomethylated promoters. (E) Genome browser view (chromosome 2, 74.5 to 75.0 Mb), showing differences in the percentage of DNAme (by RRBS) between DNMT3A1WT and various mutant 10T cells. Bottom: H2AK119Ub, H3K27me3, and H3K4me3 CUT&RUN reads from DNMT3A1WT and DNMT3A1W330R 10T cells. Genes from RefSeq database are annotated at the bottom.

