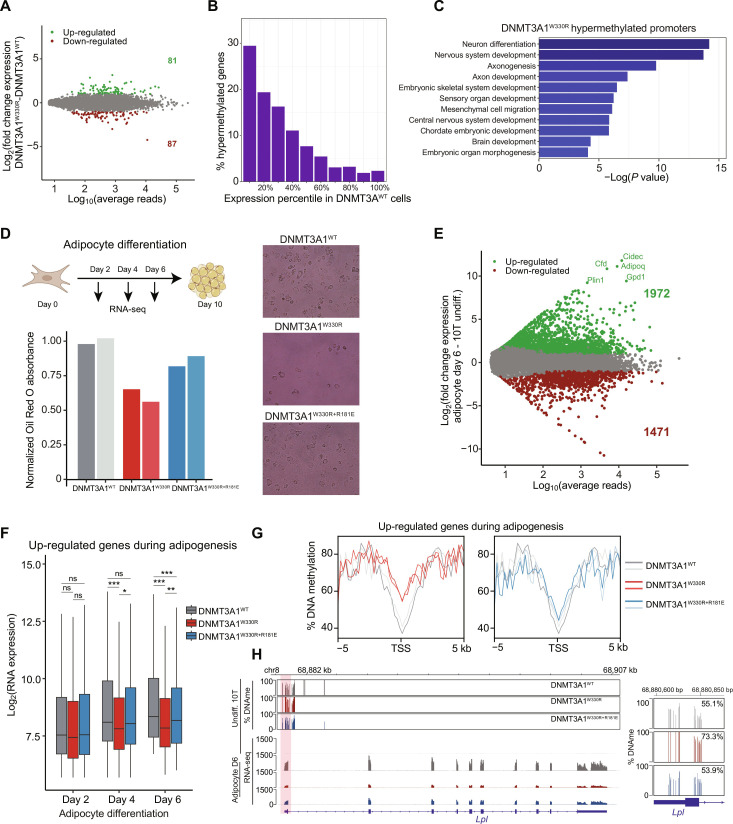
Fig. 5. Increased DNAme at Polycomb CGIs impairs differentiation-induced transcriptional activation of target genes.
(A) MA plot comparing log10 of average normalized reads per gene versus log2 fold change (LFC) in gene expression between DNMT3A1W330R and DNMT3A1WT. Significantly differentially expressed genes are highlighted in green (LFC > 2 and q < 0.01) or red (LFC < −2 and q < 0.01) (two biological replicates). (B) Bar plot showing distribution of 10T DNMT3A1W330R–hypermethylated genes into gene expression deciles in DNMT3A1WT 10T cells. (C) Bar plot of log10 P values of select GO terms of 10T DNMT3A1W330R–hypermethylated genes. (D) Top: Schematic of 10T differentiation to adipocytes. Bottom: Bar plot of normalized Red Oil O absorption in day 10 adipocytes. Representative images of Red Oil O staining are shown. (E) MA plot comparing log10 of average normalized reads per gene in DNMT3A1WT undifferentiated and day 6 adipocyte-differentiated 10T cells versus LFC in gene expression. Significantly differently expressed genes are highlighted in green [LFC > 2 and false discovery rate (FDR) < 0.01] or red (LFC < −2 and FDR < 0.01) (two biological replicates). (F) Gene expression (log2 RPM) box plot of top 500 up-regulated genes in adipocytes from days 2 to 6 (two biological replicates). Student’s t test, (ns) P > 0.05, *P < 0.05, **P < 0.01, and ***P < 0.001. (G) Enrichment plot showing the distribution of the percentage of DNAme over the promoters of up-regulated genes during adipogenesis for DNMT3A1WT, DNMT3A1W330R, and DNMT3AW330R+181E undifferentiated 10T cells. (H) Genome browser view of the percentage of DNAme and gene expression of undifferentiated and day 6 adipocyte-differentiated DNMT3A1WT, DNMT3A1W330R, and DNMT3AW330R+181E 10T cells over Lpl. Right: Average DNAme at Lpl promoter.

