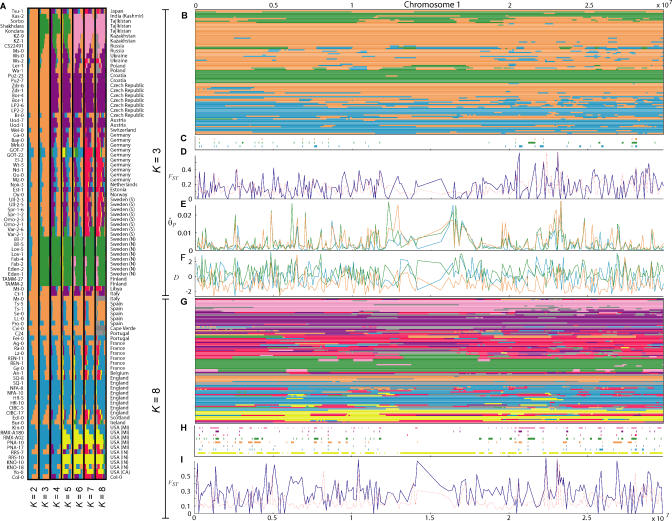
Figure 2. Population Structure and Genomic Distributions of Various Statistics.
(A) Results from Structure under different assumptions about the number of clusters (K = 2,…, 8). Each individual is represented by a line, which is partitioned into K colored segments according to the individual's estimated membership fractions in each of the K clusters. The assignment of each individual is the average across the genome.
(B) Results from Structure across Chromosome 1 for K = 3. Each chromosomal segment is colored according to the cluster in which it had the highest probability of membership.
(C) A plot showing those fragments that appear to be monophyletic with respect to each of the three clusters identified by Structure.
(D) FST with respect to the same three clusters (blue solid line) and the lower 95th percentile of FST obtained through 1,000 random permutations of the accessions (red dotted line).
(E) θ^P within each of the three clusters.
(F) Tajima's D statistic within each of the three clusters.
(G) Results from Structure across Chromosome 1 for K = 8.
(H) A plot showing those fragments that appear to be monophyletic with respect to each of these eight clusters.
(I) FST with respect to these eight clusters.

