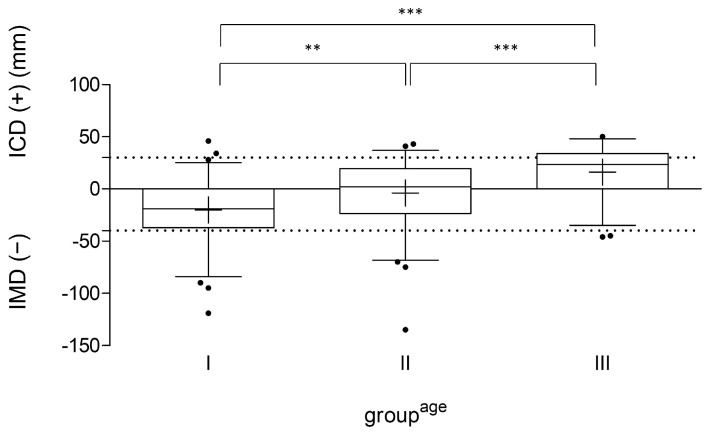
Figure 1.
ICD/IMD measurement of all participants (n = 207) in their age group (I: 7–11; II: 12–14; III: 15–18 years), indicated in millimeters (mm). The line in the box shows the median, the plus sign indicates the mean value, the whiskers mark the 5th and 95th percentiles, and the dots are individual values that deviate from the 5th and 95th percentiles. The dashed lines mark the border to pathological varus/valgus values. IMD: intermalleolar distance; ICD: intercondylar distance; ** p < 0.01; and *** p < 0.001.

