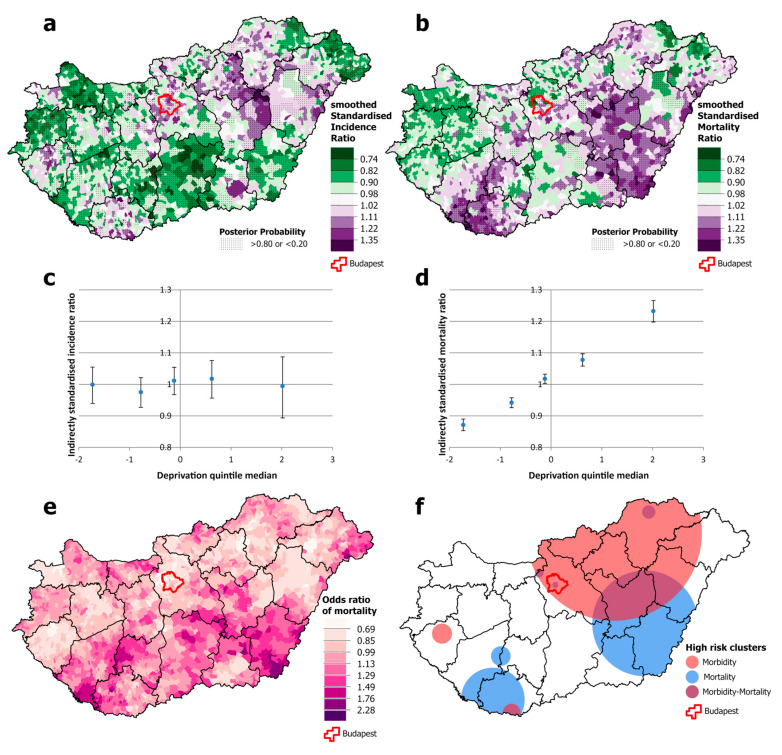
Figure 4.
Spatial distribution of incidence (a) and mortality (b) at the municipality level; the relationship between deprivation and incidence (c) and mortality risk (d) by Deprivation Index quintile; odds ratio of mortality (e) and clusters of high incidence and mortality (f) due to malignant neoplasms, for females aged 25–64 years in Hungary, 2007–2018.

