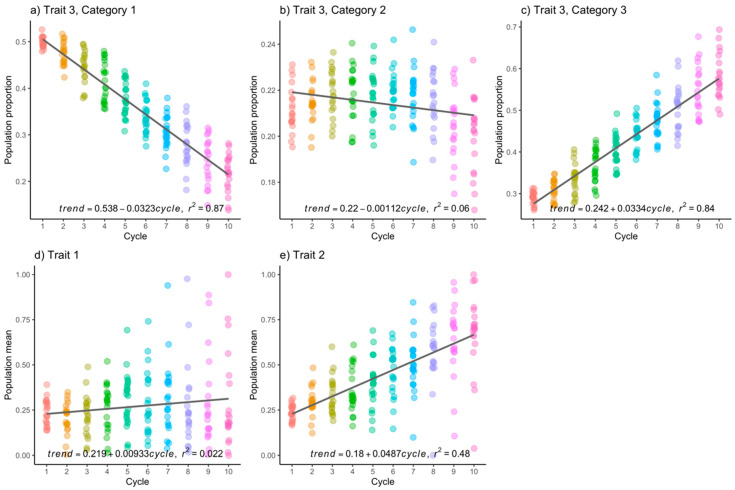
Figure 3.
(a–c) Population frequencies of each category in the categorical trait, and (d,e) the population mean of the continuous trait were examined when heritability was set at 0.3. The x-axes represent the selection cycles, whereas the y-axes represent the population proportion, or the population mean. Each dot represents a result from a Monte Carlo replicate.

