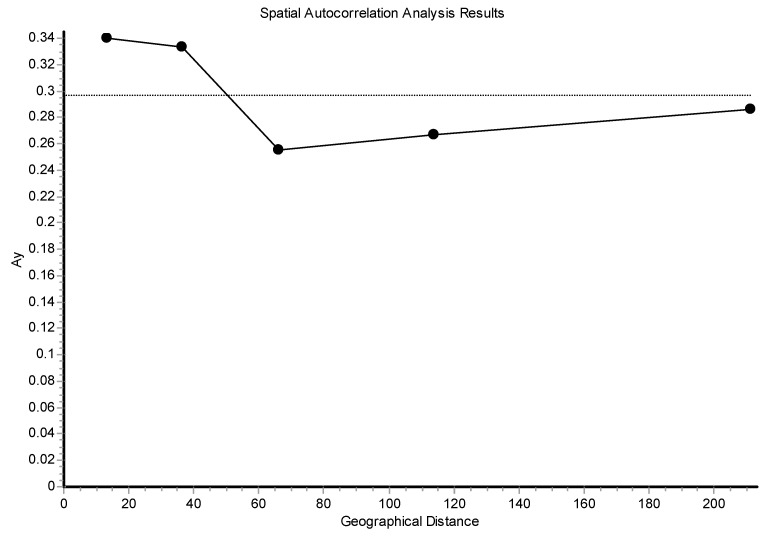
Figure 13.
Correlogram with the Ay statistic and five distance classes from a spatial autocorrelation analysis for bufeos (I. boliviensis) in the Bolivian rivers at 10 DNA microsatellite markers. Sixty-one (61) specimens were analyzed for this procedure. No spatial structure was found with DNA microsatellites. In fact, the most nearby specimens were the most differentiated ones.

