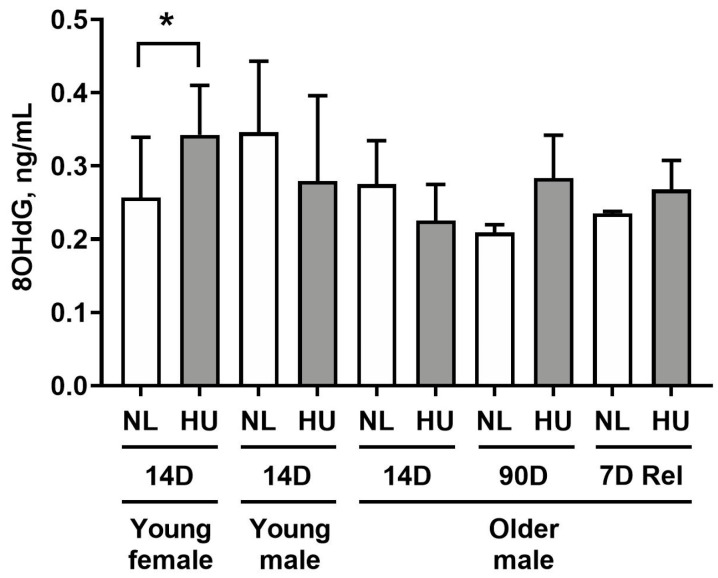
Figure 2.
8-hydroxydeoxyguanosine (8-OHdG) levels in left ventricular tissue as measured by ELISA. NL: normally loaded control, HU: hindlimb unloading, 7D Rel: 90D HU + 7D reloading and normally loaded control (NL). The HU groups were compared to their age- and sex-matched NL controls by Student’s t-test. Sample sizes: N = 5–8/group for all groups except for 90D older males, where N = 3. Values depicted are means and standard deviation. * Significant at p < 0.05 by Student’s t-test.

