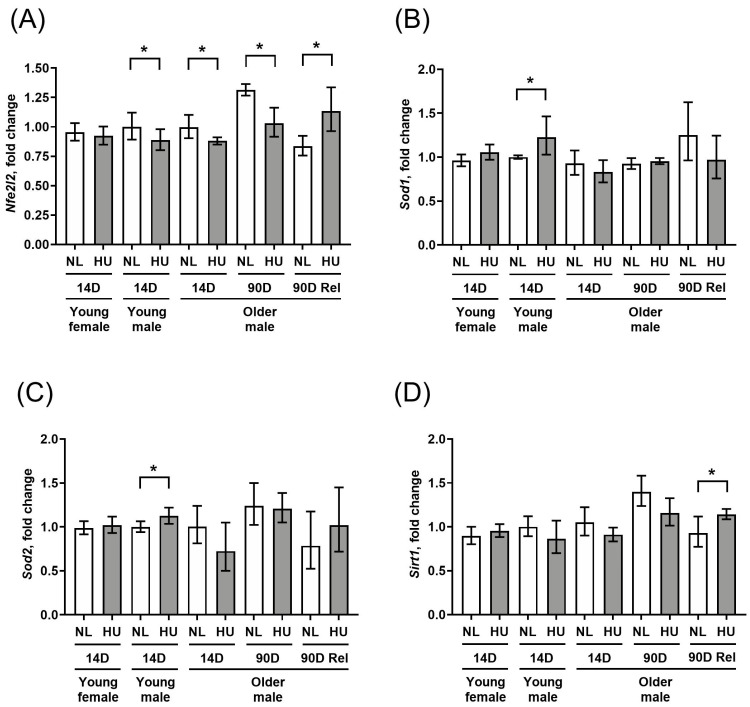
Figure 3.
Transcript levels of (A) Nfe2l2, (B) Sod1, (C) Sod2, and (D) Sirt1 in left ventricular wall as measured by qPCR. Values depicted are mean fold changes relative to young male control at 14 days of treatment as determined by the ΔΔCt method. Errors bars show upper and lower ranges. NL: normally loaded control, HU: hindlimb unloading, 90D Rel: 90D HU + 90D reloading and NL control. Sample sizes: N = 3–7/group. * Significant at p < 0.05 by Student’s t-test by comparing HU with age- and sex-matched NL control.

