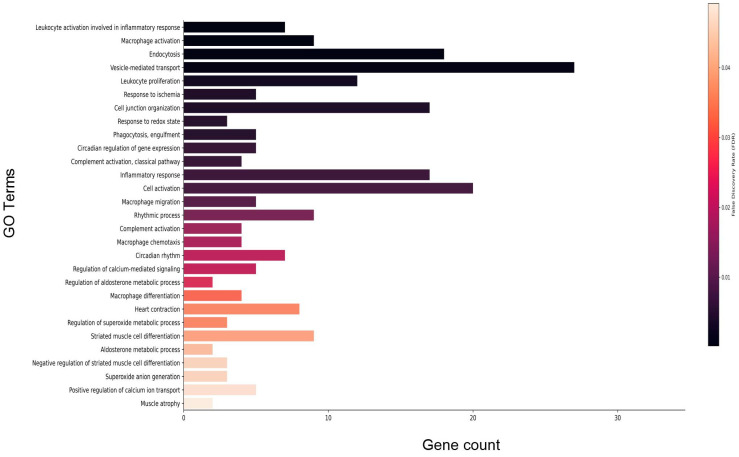
Figure 7.
Select enriched gene ontology (GO) terms for biological processes in older male 14D HU group relative to NL group. Gene count refers to the number of DEGs that matched the GO term. The vertical bar represents the color scale of the FDR with black representing the lowest FDR. Refer to Table S2 for the full list of GO terms.

