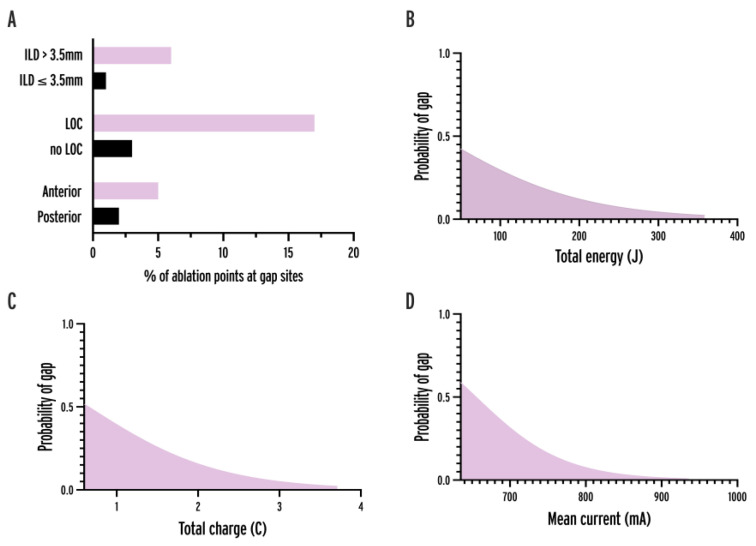
Figure 4.
Association between variables and gap probability. (A) Bar chart showing the percentage of ablation points at gap sites in the case of anterior location, loss-of-contact, and ILD > 3.5 mm. (B–D) Logistic regression curves of total energy, total charge, and mean current delivered by ablation point. ILD = interlesion distance, LOC = loss-of-contact.

