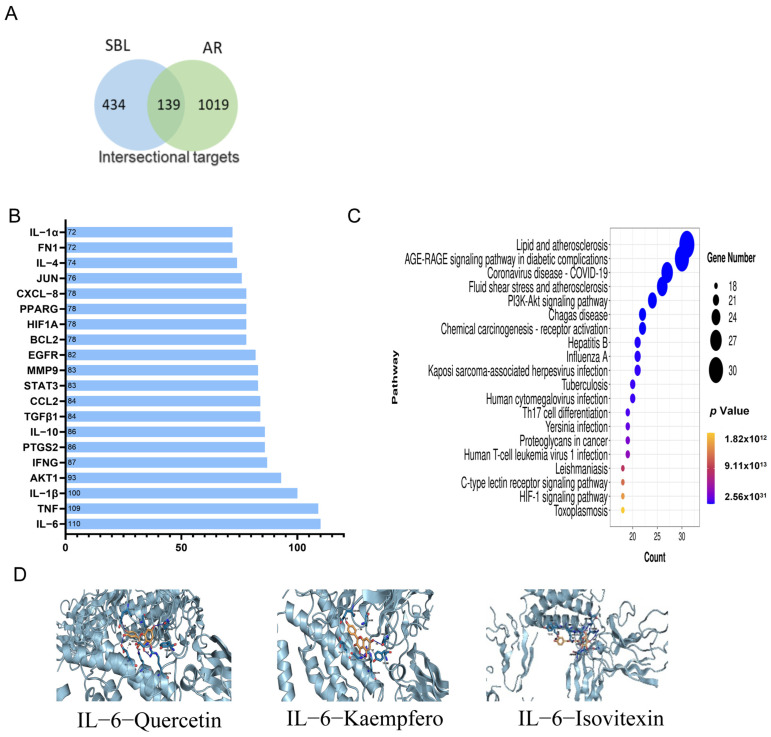
Figure 7.
SBL network pharmacology and the functional analysis. (A) The Venn graph of the intersection of SBL and AR. (B) The bar graph of the top 20 critical targets in the node degree. (C) The bubble map of the top 20 signaling pathways related to the effect of SBL in the treatment of AR based on the KEGG enrichment analysis. The X-axis and Y-axis show the enrichment score and full names of the processes, respectively, and the color and size of each bubble represent the p-value and gene count, respectively. (D) The molecular docking of active ingredients IL-6.

