Figure 3.
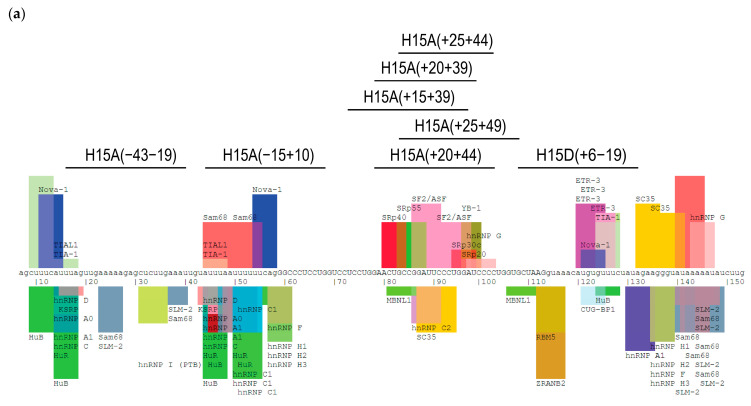
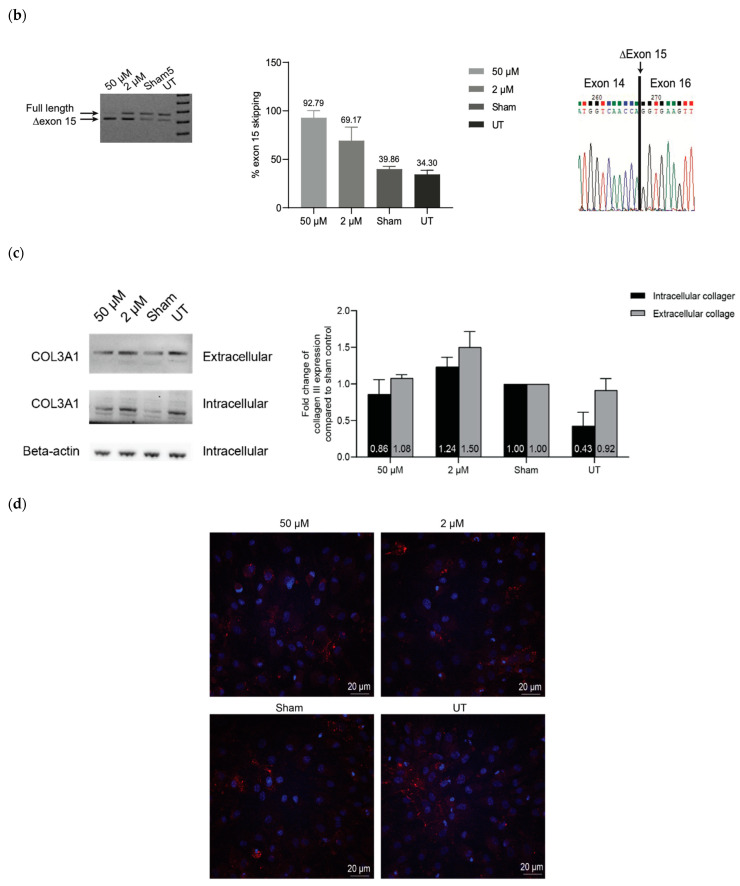
Analysis of COL3A1 exon 15 skipping, collagen III expression and deposition in IVS14-2A>G patient fibroblasts: (a) The exon 15 map indicates the ASO target sites within exon 15 and the exon-splicing enhancer and silencer motifs predicted by Splice Aid output (http://www.introni.it/splicing.html, accessed on 19 March 2024). Uppercase letters indicate exonic nucleotides and lowercase letters intronic nucleotides. The image is adapted from the original Splice Aid output (splice aid). (b) RT-PCR analysis of COL3A1 mRNA across exons 9–20. (c) Western blot analysis of intracellular and secreted collagen III protein from patient fibroblast cultures transfected with COL3A1_H14A(+20+44) PMO at 50 µM and 2 µM, at day 4. Collagen III is detected at top band; ~140 kDa, however, the presence of lower band is likely a non-specific band due to prolonged image exposure. The statistical analysis was performed on data from three independent transfections (n = 3). (d) Immunofluorescence staining of collagen III deposition (confocal images). Red: collagen III. Blue: nuclei.


