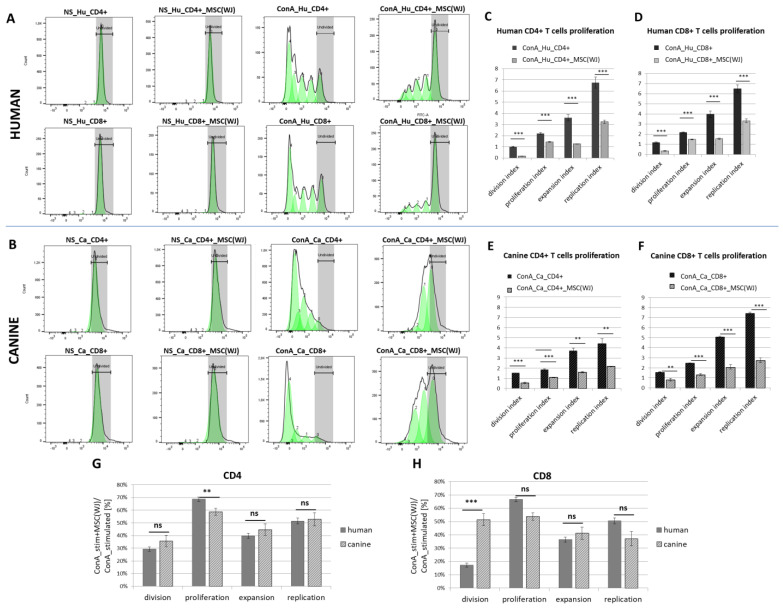
Figure 5.
The effect of Wharton jelly-derived mesenchymal stromal cells (MSC(WJ)s) on T cell proliferation. Dye dilution assay assessed using flow cytometry (CellTrace™). Representative histograms of human (A) and canine (B) T cells (CD3+) stained with membrane fluorochrome. Upper rows represent CD4+ T cells, lower rows—CD8+ T cells. Columns from the left present: (1) non-stimulated (NS) T cells (fully stained, the region were undivided cells locate is marked in gray), (2) non-stimulated T cells co-cultured with species-matched MSC(WJ), (3) concanavalin A (ConA) stimulated T cells—subsequent generations of lymphocytes have more and more diluted dye on their surface, (4) ConA stimulated T cells with addition of species-matched MSC(WJ); populations after subsequent divisions are marked as green peaks; (C–F) Graphs present mean (±SEM) values of proliferation associated indexes. Graphs show mean (±SEM) values of proliferation-related indices for human CD4+ (C), human CD8+ (D), canine CD4+ (E), and canine CD8+ (F). Each data pair shows the index for cells stimulated with ConA (black bars) and the same cells stimulated with the addition of species-compatible MSC(WJ)s (gray bars). **, p < 0.01; ***, p < 0.001, ns—p > 0.05; n = 6–8, MSC(WJ)s from four different donors (for each species) were used for experiments. (G,H) comparison of the effect of human and canine MSC(WJ)s on the proliferation of T cells.

