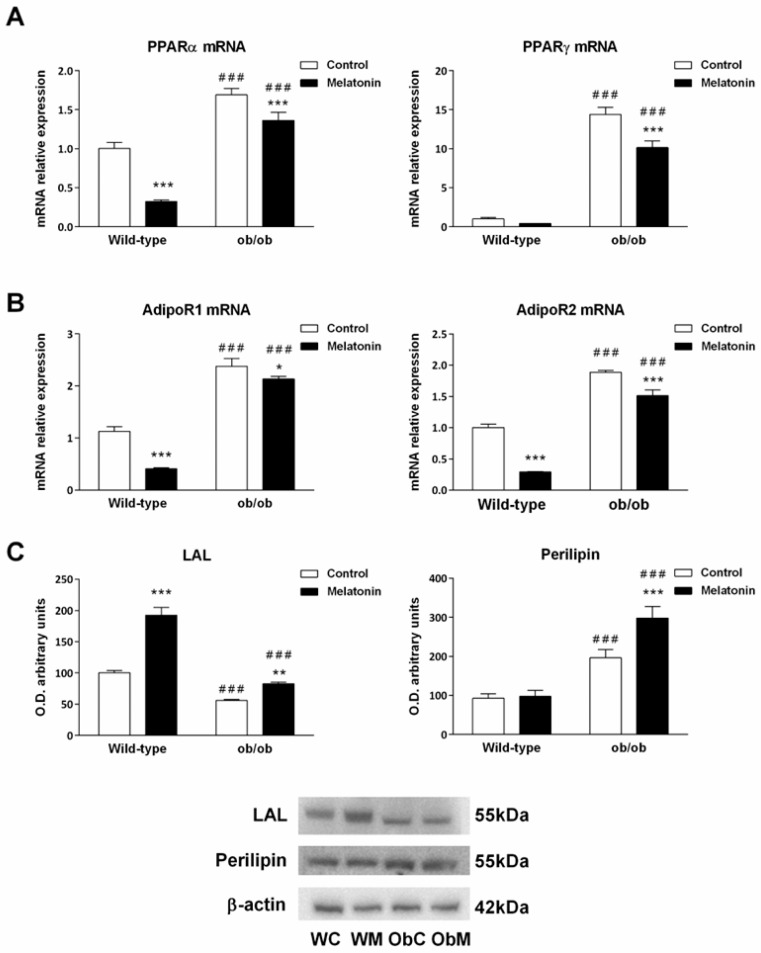
Figure 1.
Adipogenic, lipogenic, adiponectin-related, and lipid droplet markers from the livers of wild-type and ob/ob mice. (A) mRNA expression of peroxisome proliferator-activated receptor alpha (PPARα) and gamma (PPARγ). (B) mRNA expression of adiponectin receptors (AdipoR1 and AdipoR2). (C) Bar chart showing the semiquantitative optical density (arbitrary units of blot bands) and Western blot results of lysosomal acid lipase (LAL) and perilipin protein expression normalized to β-actin. The data are expressed as the means ± SDs, which were calculated from at least three independent measurements. WC—untreated wild-type; WM—wild-type plus melatonin; ObC—untreated ob/ob; ObM—ob/ob plus melatonin. Statistical comparisons: # wild-type vs. ob/ob and * treated with melatonin vs. untreated counterpart. The number of symbols indicates the level of statistical significance: * for p < 0.050, ** for p < 0.010, and ***/### for p < 0.001.

