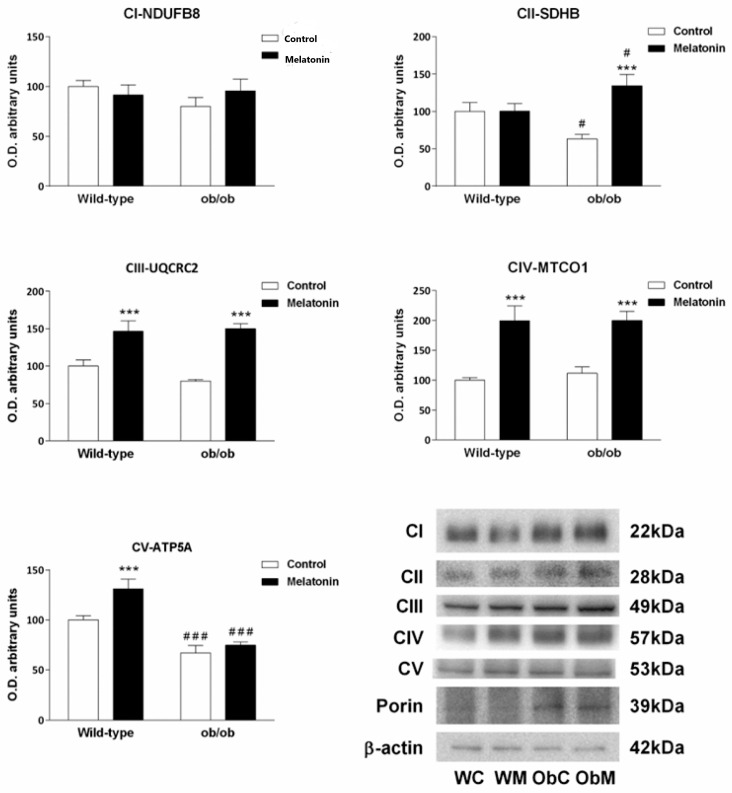
Figure 4.
Electron transport chain complexes profile in the livers of wild-type and ob/ob mice. Bar chart showing the semiquantitative optical density (arbitrary units of blot bands) and representative Western blot images of NADH dehydrogenase (ubiquinone) 1 b subcomplex 8 (NDUFB8) from complex I (CI), the iron–sulfur subunit (SDHB) from complex II (CII), the ubiquinol–cytochrome c reductase core protein II (UQCRC2) subunit from complex III (CIII), cytochrome c oxidase subunit I (MTCO1) from complex IV (CIV), and ATP synthase subunit α (ATP5A) from complex V (CV). First, all the immunoblots were normalized to β-actin as a total extract loading control. Then, the complexes were normalized to porin as a mitochondrial mass marker. The data are expressed as the means ± SDs that were calculated from at least three separate measurements. WC—untreated wild-type; WM—wild-type plus melatonin; ObC—untreated ob/ob; ObM—ob/ob plus melatonin. Statistical comparisons: # wild-type vs. ob/ob and * treated with melatonin vs. untreated counterpart. The number of symbols indicates the level of statistical significance: # for p < 0.050 and ***/### for p < 0.001.

