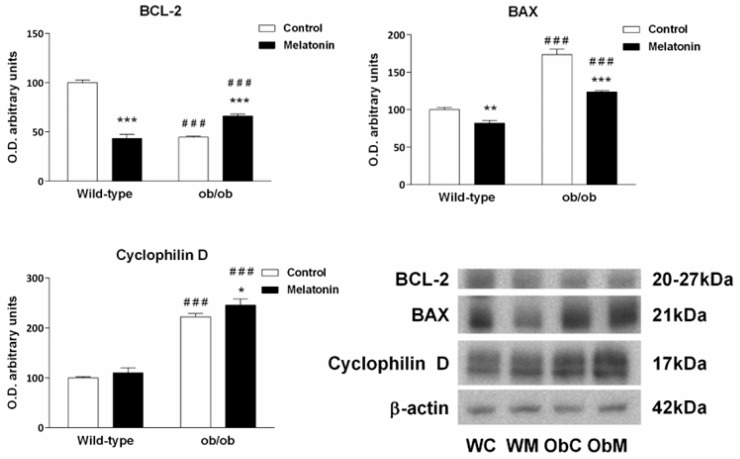
Figure 8.
Mitochondrial outer membrane permeabilization markers and cyclophilin D in the livers of wild-type and ob/ob mice. Bar chart showing the semiquantitative optical density (arbitrary units of blot bands) and Western blot images of B-cell lymphoma 2 (BCL2), BCL2-associated X protein (BAX) and cyclophilin D from Western blots normalized to β-actin. The data are expressed as the means ± SDs that were calculated from at least three separate measurements. WC—untreated wild-type; WM—wild-type plus melatonin; ObC—untreated ob/ob; ObM—ob/ob plus melatonin. Statistical comparisons: # wild-type vs. ob/ob and * treated with melatonin vs. untreated counterpart. The number of symbols indicates the level of statistical significance: * for p < 0.050, ** for p < 0.010, and ***/### for p < 0.001.

