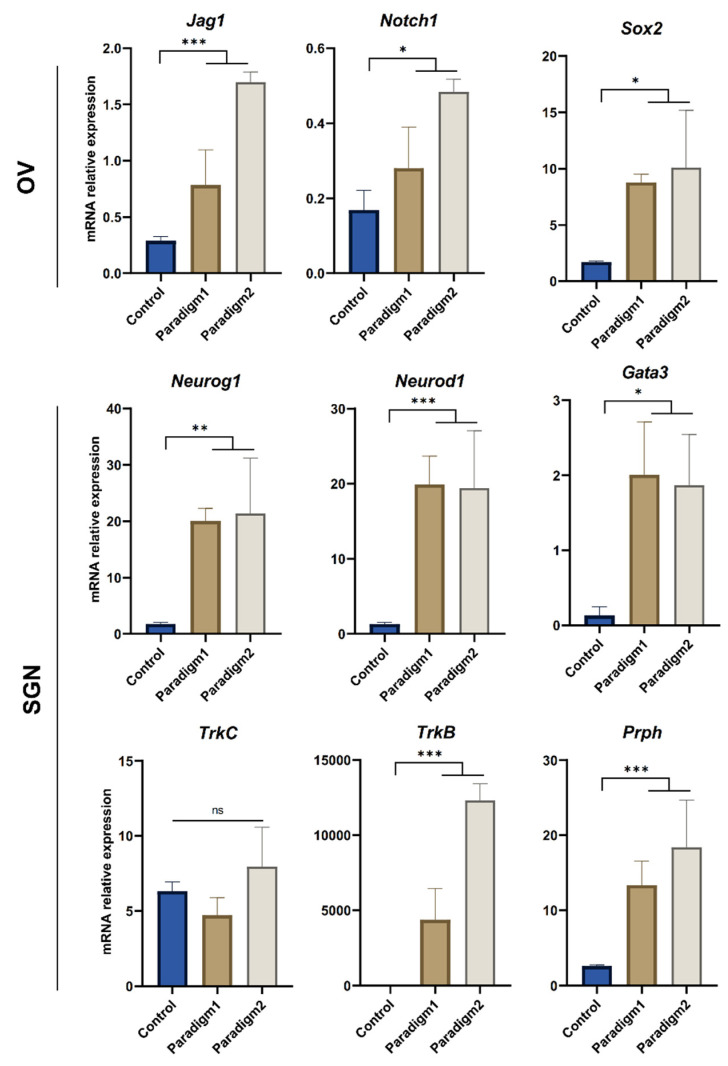
Figure 3.
Analyses of otic vesicle and SGN gene markers in differentiated cells at 21 DIV. Bar charts showing relative gene expression levels were obtained by qPCR analyses of genes featuring OV and SGN lineages in cells differentiated under paradigms 1 and 2, as compared to control culture conditions. The differentiated cells were collected at 21 DIV from 3 independent culture experiments. A significant upregulation of OV and SGN markers was observed in both paradigms when compared to the control culture condition. Moreover, paradigm 2 showed the most significant upregulation of a subset (Prph, TrkB) related to both OV and SGN lineage. Statistical differences were determined with one way ANOVA. p values are indicated with * p ≤ 0.05, ** p ≤ 0.01, *** p ≤ 0.001, ns: not significant.

