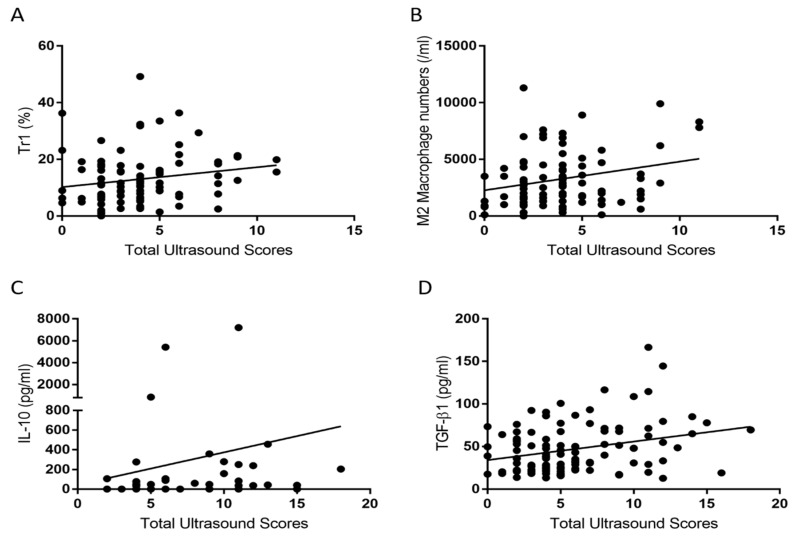
Figure 2.
Correlation of cytokines and cells with Total Ultrasound Scores. Ultrasound grades were scored as in ref. [20]: (A) The percentage of Tr1 cells (n = 89) correlated with Total Ultrasound Scores (the sum of ultrasound grades for grayscale and power Doppler of all examined joints) in the ultrasound grade subgroup (≤1) at rho = 0.242 and p = 0.022. Tr1 is presented as percentages (%). (B) The M2 macrophage numbers (n = 89) correlated with Total Ultrasound Scores in the ultrasound grade subgroup (≤1) at rho = 0.221 and p = 0.038. (C) The IL-10 level (n = 58) correlated with Total Ultrasound Scores in the high ultrasound grade subgroup (>1) at rho = 0.311 and p = 0.017. (D) The TGF-β1 level (n = 147) correlated with Total Ultrasound Scores at rho = 0.203 and p = 0.033. Correlation performed by Spearman’s correlation.

