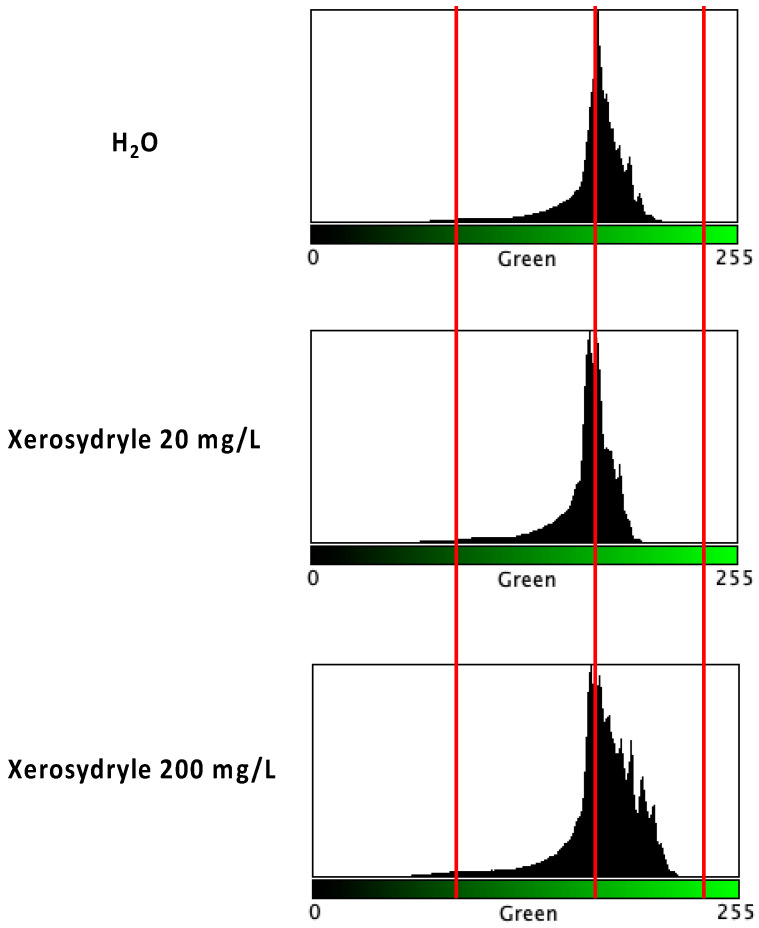
Figure 2.
Image analysis of chlorophyll accumulation. After scanning 50 seedlings per treatment, an RGB color analysis was performed and the “green” channel was extracted for comparison. Vertical red bars highlight the profile differences between treatments and the shift in the histograms. The x-axis represents the values in the 8-bit scale of “green” levels. The y-axis represents the pixel count.

