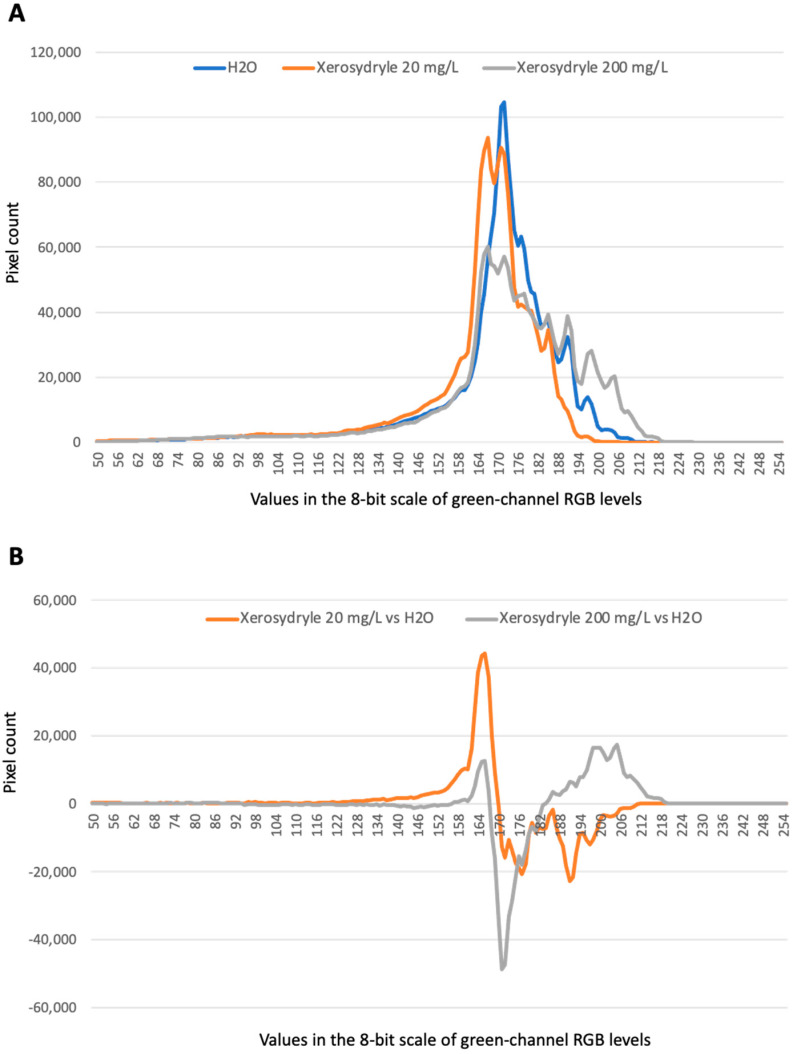
Figure 3.
Comparative image analysis of chlorophyll accumulation. (A) The “green” channel of the RGB histogram for the three samples is plotted. (B) Point-to-point difference of the “green” channel values between xerosydryle 20 mg/L (grey line) and xerosydryle 200 mg/L (orange line) and water (baseline).

