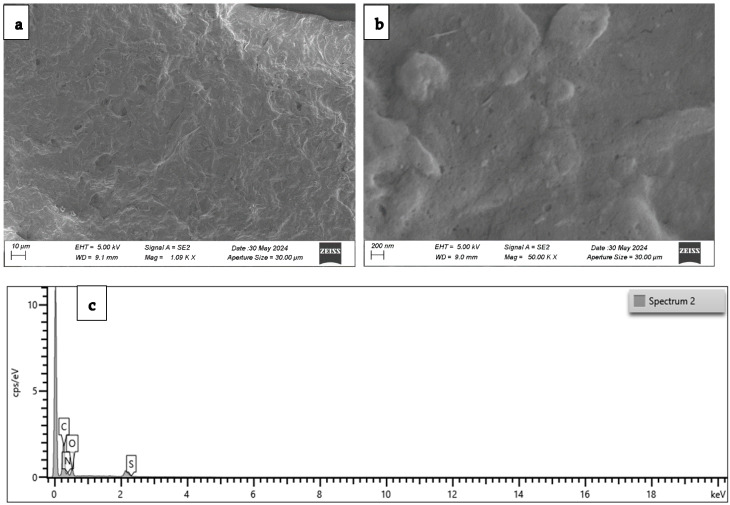
Figure A3.
SEM images at two different magnification values of a sample obtained by redispersion in Milli-Q® water, deposited on an aluminum stub, and sputter coated with gold. (c) EDX pattern of the same image displaying all the peaks including impurities and metals deriving from stub and metal coating. Bars correspond to (a) 10 μm and (b) 200 nanometers. The X-axis represents the energy while the Y-axis corresponds to counts per second per electron-Volt.

