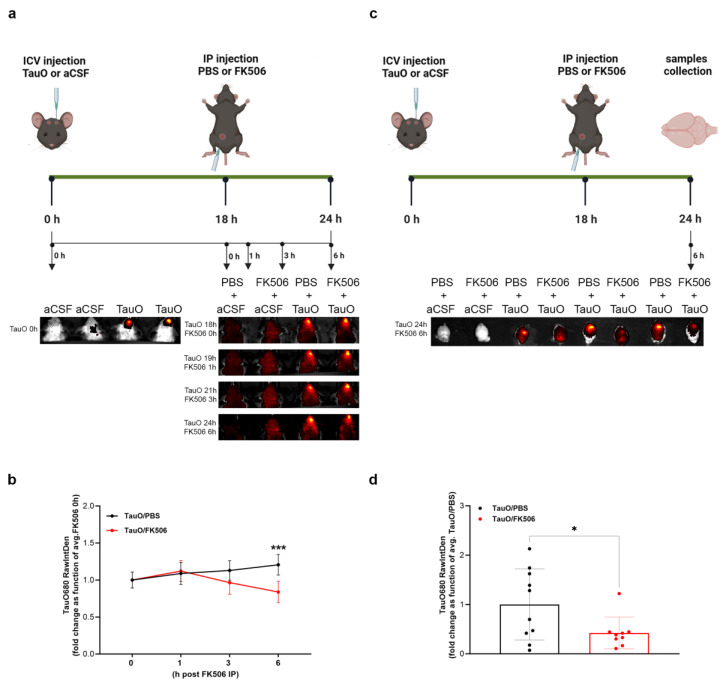
Figure 4.
Longitudinal in vivo imaging of mice ICV injected with labeled TauO and treated with FK506. (a) Graphical description of the experimental design; (b) quantification analysis of the fluorescence intensity within the region of interest (ROI) in PBS + TauO and FK506 + TauO mice. (c) Graphical description of the experimental design with the collection of the brains as final step; (d) quantification analysis of the fluorescence intensity within the region of interest (ROI) in PBS + TauO and FK506 + TauO mouse brains. The fluorescence threshold, established by PBS + aCSF and FK506 + aCSF baseline signals, guided the analysis of ROI around the fluorescent signals. Data represent the mean ± SEM; t biological replicates n = 10 per group; one-way ANOVA with Šídák’s post hoc corrections for multiple comparison; * p < 0.05 and *** p < 0.001.

