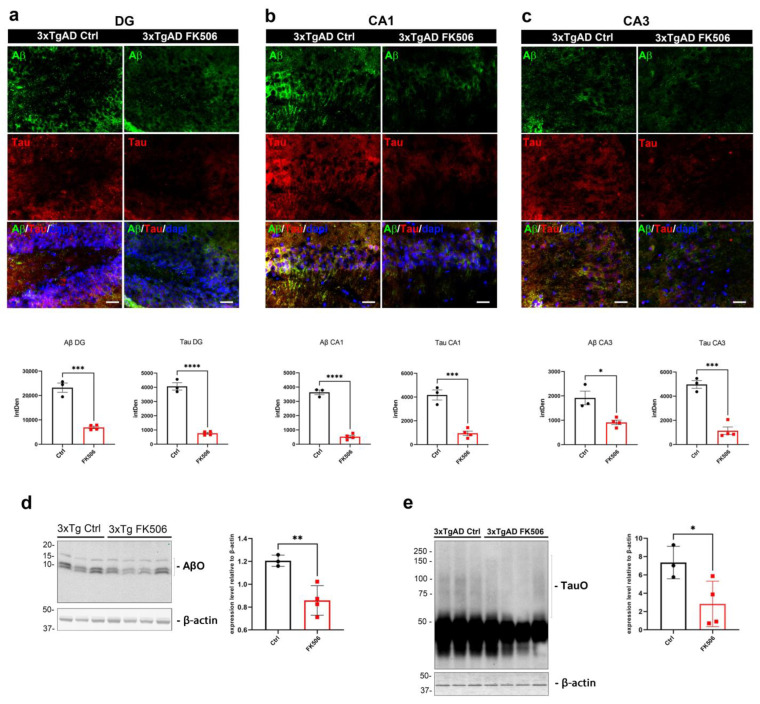
Figure 7.
Impact of chronic FK506 on AD neuropathology in 3xTgAD mice. (a–c) Representative immunofluorescence images (upper panels) and relative quantification analyses (lower panels) of Aβ (green) and Tau (red) in (a) dentate gyrus (DG), (b) CA1, and (c) CA3 of control and FK506-treated 3xTgAD mice; (d,e) representative Western blot analyses of (d) AβO and (e) TauO and relative quantifications in the hippocampus of control and FK506-treated 3xTgAD mice. Original magnification (60×), scale bar (30 µm). Data represent the mean ± SD; biological replicates n = 3 (3xTgAD Ctrl) and n = 4 (3xTgAD + FK506); one-tailed t-test; * p < 0.05, ** p < 0.01, *** p < 0.001, and **** p < 0.0001.

