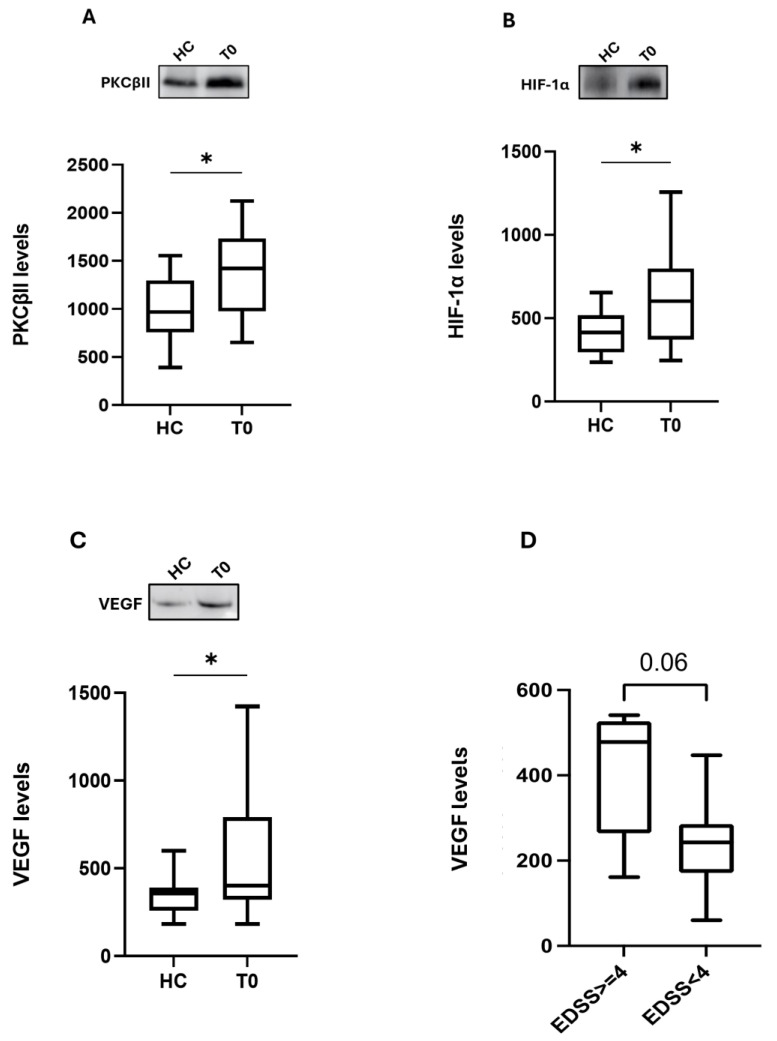
Figure 1.
PKCβII, HIF-1α, and VEGF basal protein expression in PBMCs from HC and MS patients. Upper side: cropped representative western blotting images; lower side: boxplots of PKCβII (A), HIF-1α (B), and VEGF (C) protein expression in PBMCs from HC (n = 17) and MS patients (T0, n = 17), and from MS patients in relation to baseline EDSS scores (D). The results are expressed as the mean grey level ratios × 103 (mean ± S.E.M.) of the PKCβII (A), HIF-1α (B), and VEGF (C,D) immunoreactivities measured by western blotting and normalized on ponceau signals. Data were analyzed by the Mann–Whitney test; * p < 0.05. HC = healthy controls; T0 = MS patients before OCR (ocrelizumab) therapy; EDSS: Expanded Disability Status Scale.

