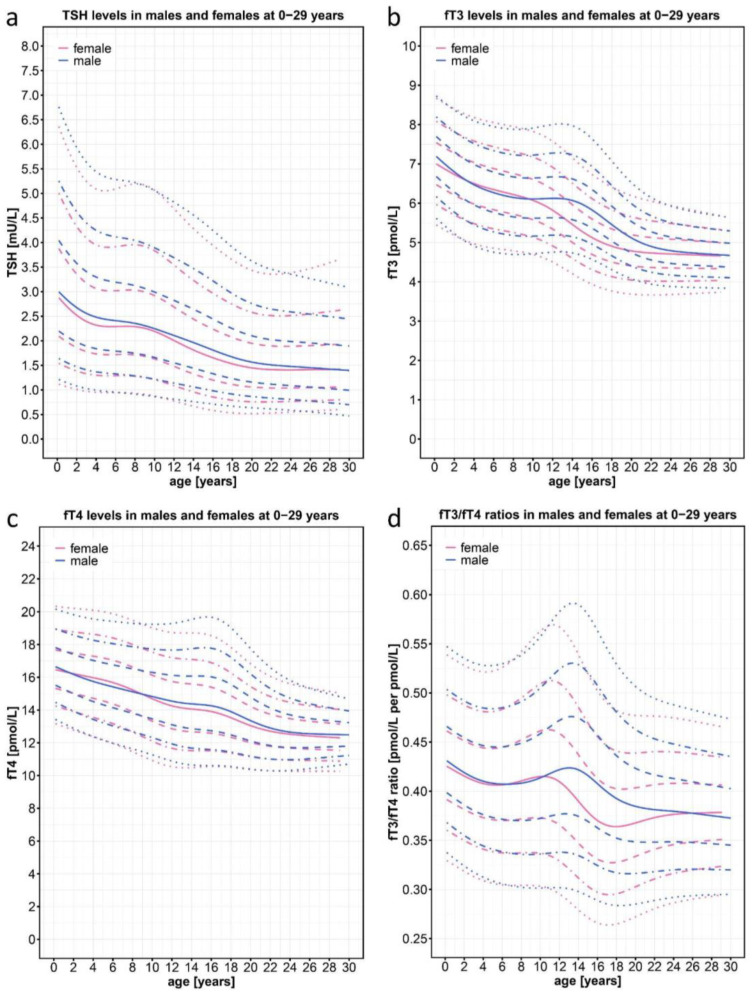
Figure 2.
Normal percentiles of TSH, fT3, fT4, and the fT3/fT4 ratio derived from n = 23,522 data points of individuals (n = 11,325 females; n = 12,197 males) aged 0–29 years from the joint KiGGS baseline, KiGGS Wave 2, and LIFE studies based on the general pediatric and young adult population of Germany. The colored lines represent the 97th, 90th, 75th, 50th, 25th, 10th, and 3rd percentiles; pink represents female patients and blue represents male patients. NB: Point clouds for the fT3/fT4 centile charts are shown on Figure S1.

