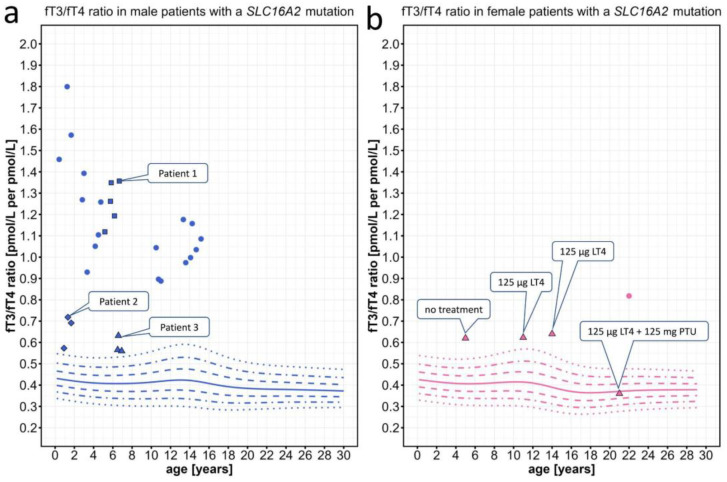
Figure 4.
Individual fT3/fT4 ratio data points plotted against the percentiles for male and female patients with SLC16A2 mutations. Information on individual patients can be found in Table S1. (a) We present repeated measurements for two mildly affected male patients (diamonds, patient 2; triangle, patient 3) and one severely affected male patient (squares, patient 1). (b) Triangles represent a female patient treated with levothyroxine (LT4) and later by addition of 6-n-propyl-2 thiouracil (PTU), which normalized the fT3/fT4 ratio. The colored lines represent the 97th, 90th, 75th, 50th, 25th, 10th, and 3rd percentiles.

