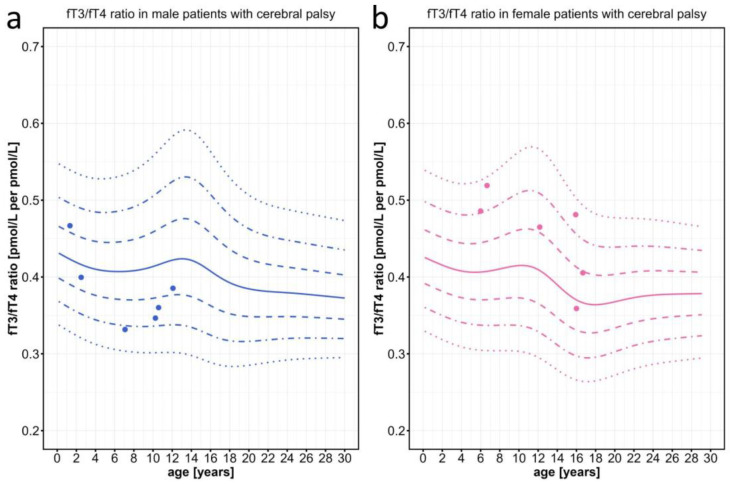
Figure 6.
Individual fT3/fT4 ratio data points plotted against the percentiles for male and female patients with severe cerebral palsy, who served as pathological controls with global developmental delay and without any problems in their thyroid hormone system. Information on the patients can be found in Table S1. The colored lines represent the 97th, 90th, 75th, 50th, 25th, 10th, and 3rd percentiles.

