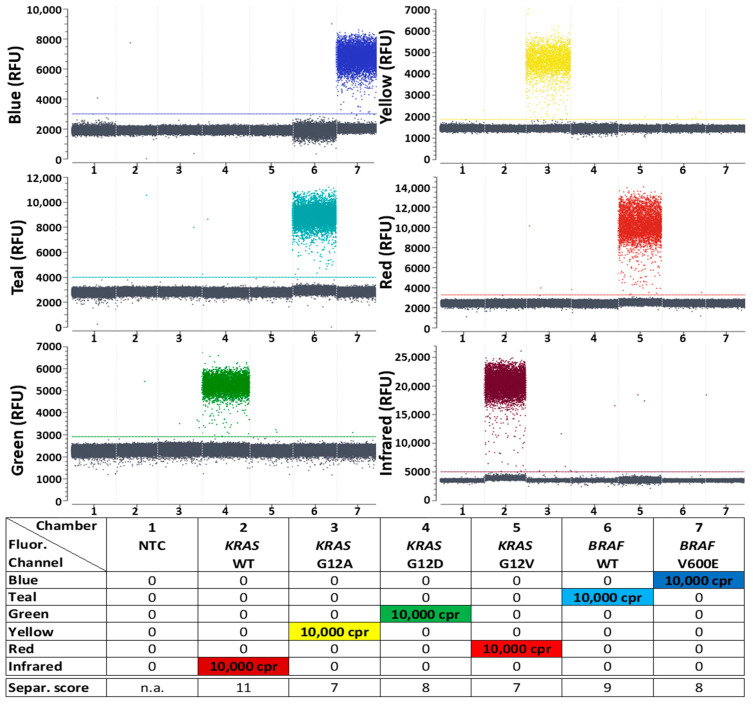
Figure 2.
Differentiation between positive and negative signal populations in Digital PCR (dPCR) reactions using the first 6-plex generic reporter set in combination with a target panel for detection of KRAS and BRAF mutations and their corresponding WT controls. One-dimensional plots of all 6 fluorescence channels (labeled “Blue”, Teal”, “Green”, “Yellow”, “Red” and “Infrared”) of the naica® Prism6 are shown. Details of the reporters used in each detection channel, including sequences, fluorophores and quenchers, can be seen in Table S1. All detectable droplets formed in seven separate reaction chambers are shown on the x-axis, and the relative fluorescence units (RFU) of each droplet are shown on the y-axis. Reaction chamber details from left to right: (1) no template control (NTC) without target molecule presence; (2–7) 10,000 copies per reaction (cpr) of one kind of target sequence each. A more detailed version of this figure, with samples containing all six targets at once, is shown in Figure S1. Separability scores between positive and negative droplet populations, as calculated by the Crystal Miner software, are indicated at the bottom of the legend. n.a.: not applicable.

