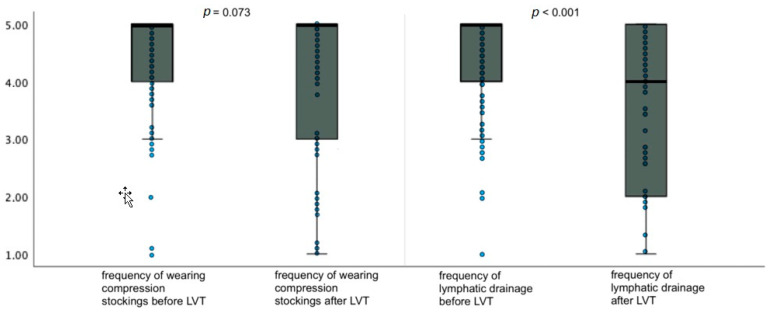
Figure 7.
Changes in HRQoL regarding the burden of therapy as asked in the adapted SF-12 questionnaire for patients with lymphoedema after LVT. Data are represented as the 25th to 75th percentiles (boxes) with the median (line in the box) and data points in the form of a scatter plot. The X-axis shows the respective category of the questionnaire pre- and postoperatively. The Y-axis shows the score given by the patients (from 1 to 5). The p-value was determined using the t-test for independent samples.

