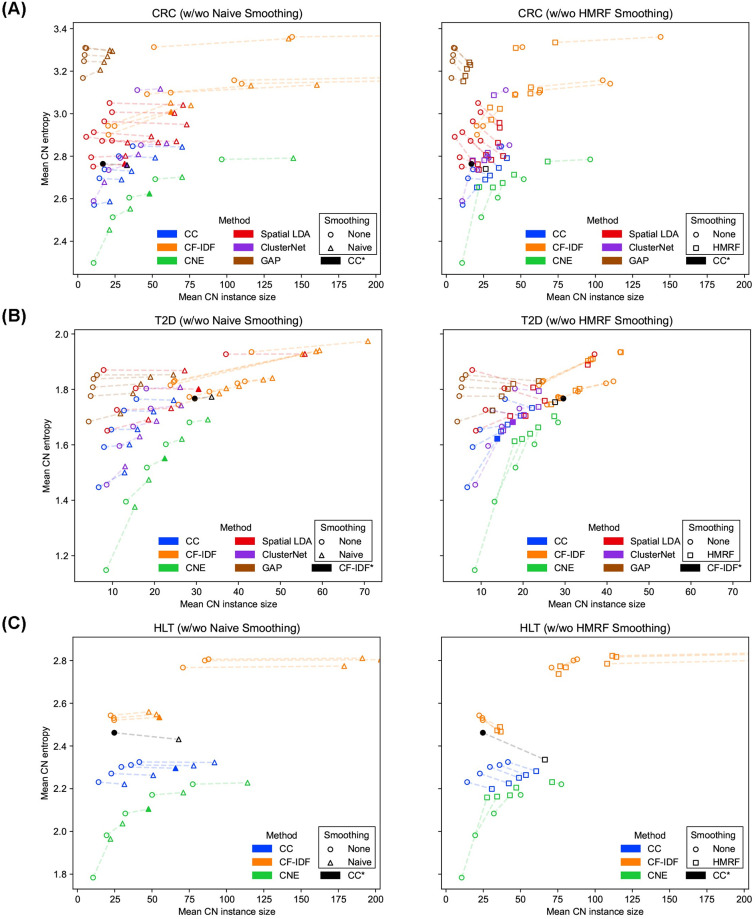
Fig 2. Performance comparison of CN identification methods.
(A)–(C) The performance of CN identification methods on the CRC, T2D, and HLT datasets, respectively. Each data point represents a CN result. The shape of data point is decided by how it has been smoothed. The dashed lines connect CN results under different smoothing techniques. The x axis shows the granularity of CNs and larger x means lower granularity. The y axis shows the purity of CNs and larger y means lower purity. Filled markers represent CNs with selected hyperparameters. The results used by the original studies are marked with asterisks. CNE consistently produced purer CNs over other methods under various granularities on different datasets.

