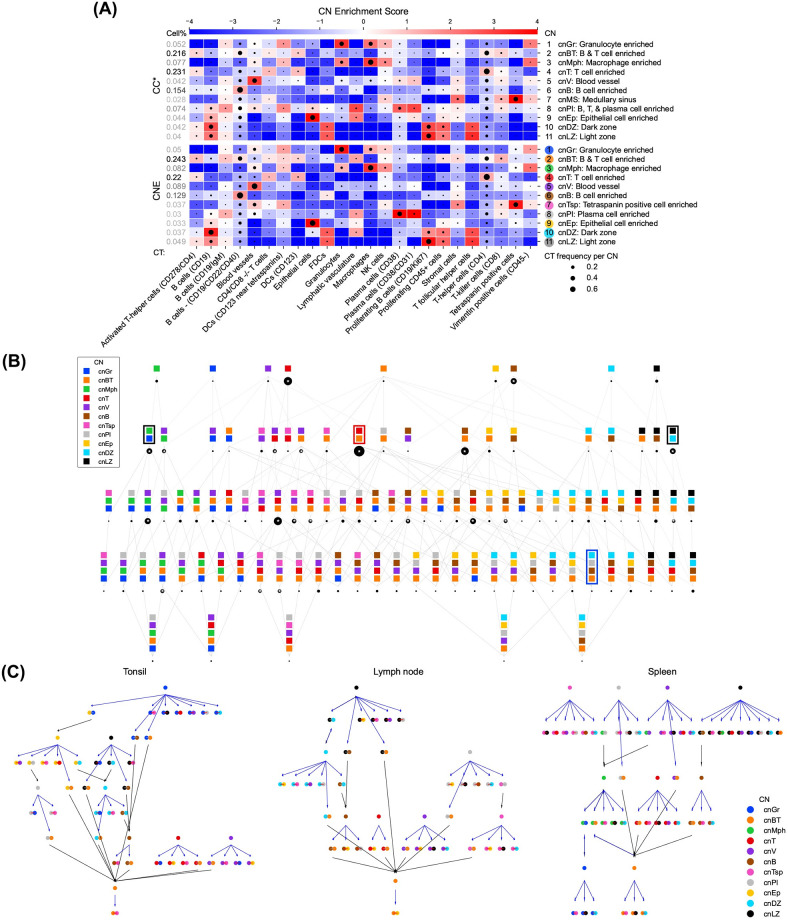
Fig 5. In all human lymphoid tissues, local interactions involved the T cell enriched CN necessitate the presence of B cells, while the light zone CN is not always surrounded by the B cell enriched CN.
(A) CT Enrichment analysis for CNE and the original CC results (CC*) on the HLT dataset. CNE produced purer CNs enriched by one CT or several related CTs than other methods. Enrichment scores are given by CT-CN PWMs. CTs are annotated in the original dataset, and CNs are generated by CNTools for each of the three methods indicated and named as the most enriched CTs. CT frequencies per CN are represented by the sizes of black circles in the corresponding blocks. (B) CN Combination Map analysis for CNE on the HLT dataset. Most findings of CNE matches the original study [8], which is better than CC and CF-IDF mainly because of the purity of CNs. (i) cnLZ and cnDZ, and cnGr and cnMph, were more likely to be restricted together than separated (black boxes). (ii) cnV and cnBT existed in SCs combined with many other CNs. The wide spread of cnV agrees with the biological fact that blood vessels are ubiquitous in biological activities. (iii) cnB and cnT had a large SC just containing themselves and cnBT had a small one. No methods found cnPI alone in a SC, but CNE and CF-IDF could support its abundance among SCs. (iv) cnT occurred much more often with cnBT in SCs than without it, suggesting that local interactions between cnT and other CNs necessitate the presence of B cells (red boxes). (v) the outer zones [24], SCs made up of cnB, cnBT/cnT, and cnLZ/cnDZ, were found by all three methods, while only CNE gave such a SC with cnPI, showing a niche within the follicle for plasma cells [25] (blue box). A cell is assigned to a SC, set of CNs, if more than 90% of its nearest 100 cells are assigned to one of those CNs and if it is the minimal set of CNs that has this property. The number of cells in each SC is represented by the size of the black circle below it. The top 20 largest SCs are marked with asterisks. (C) Assembly Rule Identification analysis for CNE on the HLT dataset. CNE preserved more conserved assembly rules (cnT → cnBT-cnT, cnV → cnV-cnPl, cnLZ → cnB-cnLZ, cnB → cnB-cnPl, and cnB → cnB-cnBT) than CC, which in turn reproduced more than CF-IDF. Furthermore, in the spleen, CNE produced cnLZ → cnLZ-cnB and cnLZ → cnLZnotX for other existing CNs, showing that cnLZ was surrounded only by cnB, while in the tonsil and lymph nodes, cnLZ → cnBT-cnLZ was produced, indicating that cnLZ was surrounded not only by cnB. Each node represents a motif, where the edge between CNs is gray if CNs are adjacent and red otherwise. Each edge represents an assembly rule, whose color is blue if it extends 70% of the source motif instances to the target motif or black if the source motif is part of the target motif. Two tonsil images were merged.

