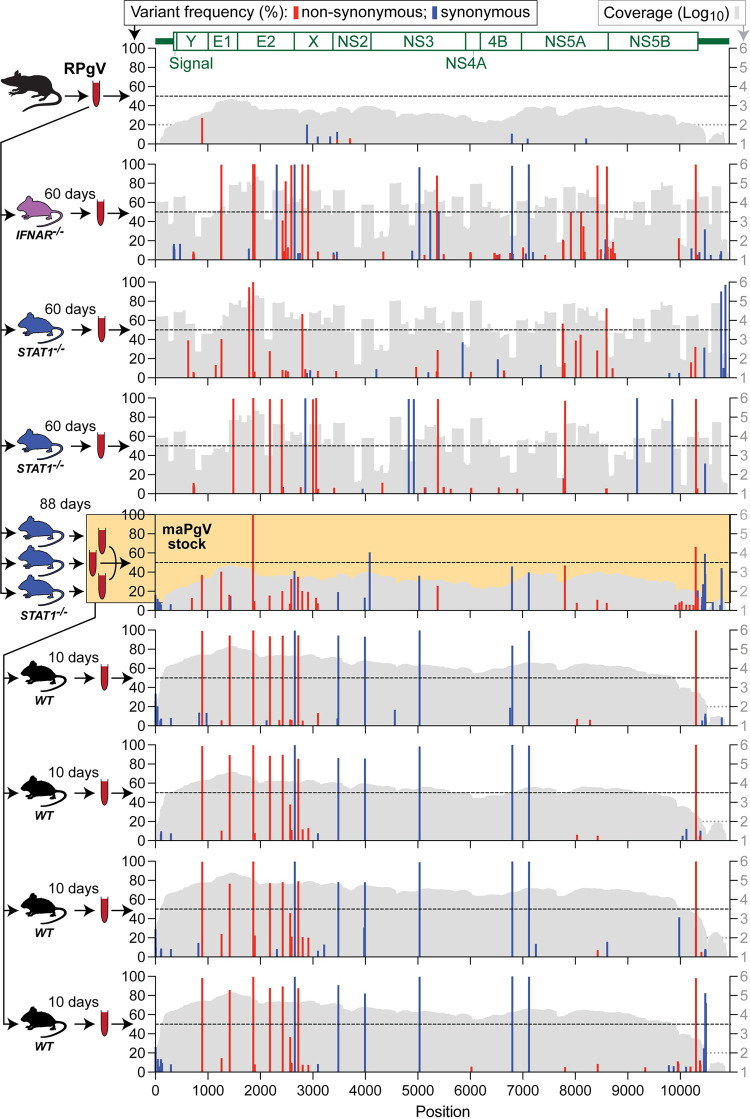
Fig 3. A single mutation in the E2 envelope glycoprotein (R80L) is important for murine adaptation of RPgV.
Illumina deep sequencing of RPgV at various points during mouse adaptation. The genome position of RPgV/maPgV is shown along the X-axis, with a schematic of predicted mature proteins shown in green across the top. The frequency of non-synonymous mutations (red) and synonymous variants >5% relative to the RPgV consensus sequence are shown along the left Y-axis, with a dashed black line denoting 50% frequency (i.e., consensus-level variants). Coverage is shown in gray on a log10 scale along the right Y-axis with a read-depth cutoff of 100 shown as a gray dashed line, below which variants were not called. The pooled “maPgV stock” described in Fig 1 is highlighted in yellow. Note that some samples were sequenced via unbiased deep sequencing and others were sequenced by multiplexed PCR amplicon sequencing, generating the “mountainous” versus “city-scape” appearing coverage plots, respectively.

