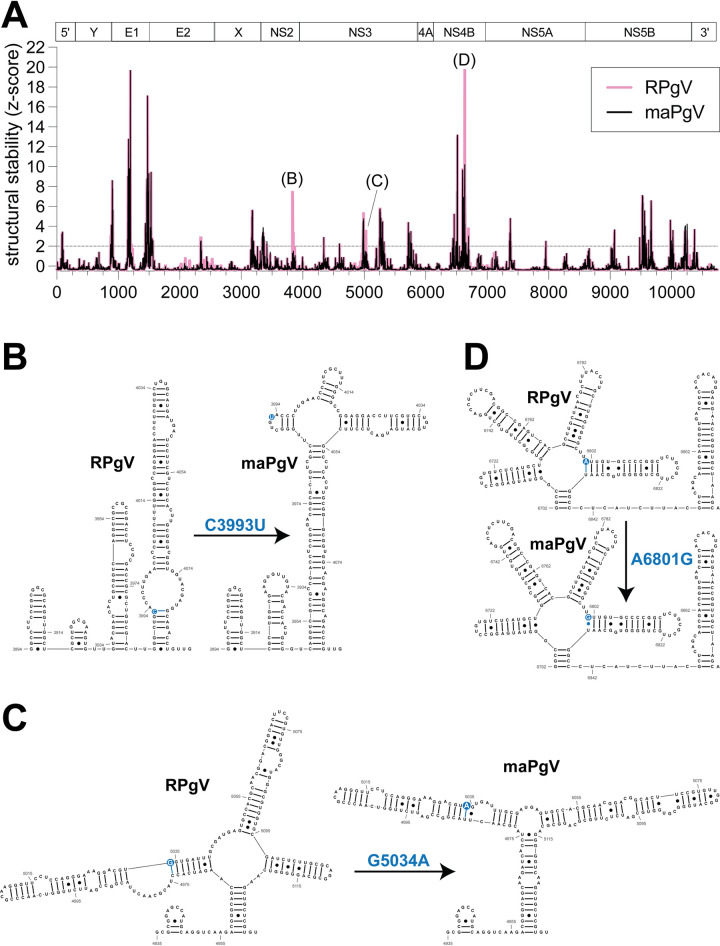
Fig 6. Predicted RPgV RNA genome structure and mouse-adapting mutations.
(A) RNAfold analysis comparing RPgV (pink) to maPgV (black) across the entire PgV genome, with genomic architecture depicted above the graph. Predicted RNA secondary structure of 200 nucleotide windows (step size = 1 nt) were computed using RNAfold and the RNA structure score (RSS; frequency of the MFE/ensemble diversity) and z-score of the RSS were calculated. Regions where structural stability differs significantly between RPgV and maPgV are identified and RNA structures are shown in greater detail, with the SNP highlighted in blue (B-D).

