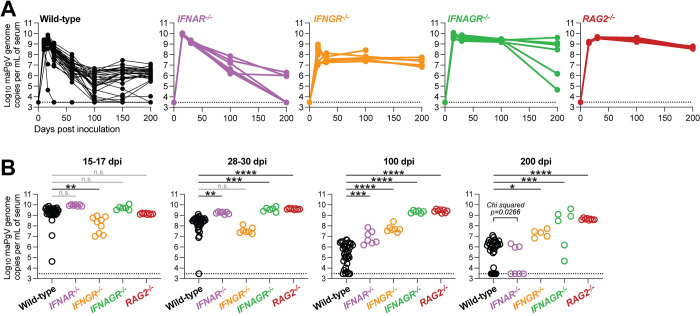
Fig 7. Type-I interferon signaling contributes to PgV persistence.
(A) Serum viral loads of maPgV in various immunocompromised mouse strains over time (wild-type: black, n = 25; IFNAR-/-: purple, n = 7; IFNGR-/-: orange, n = 7; IFNAGR-/-: green, n = 6; RAG-/-: red, n = 8). Combined data from two independent cohorts are shown. (B) Comparison of maPgV serum viral loads in immunocompromised mice strains at various time points during infection using one-way ANOVA in relation to wild-type mice, corrected for multiple comparisons (*:p≤0.05; **:p≤0.01; ***:p≤0.001; ****:p≤0.0001). Note: data from Wild-type mice is from the same data-set shown in Fig 2; data from immunocompromised mice is combined from two independent cohorts.

