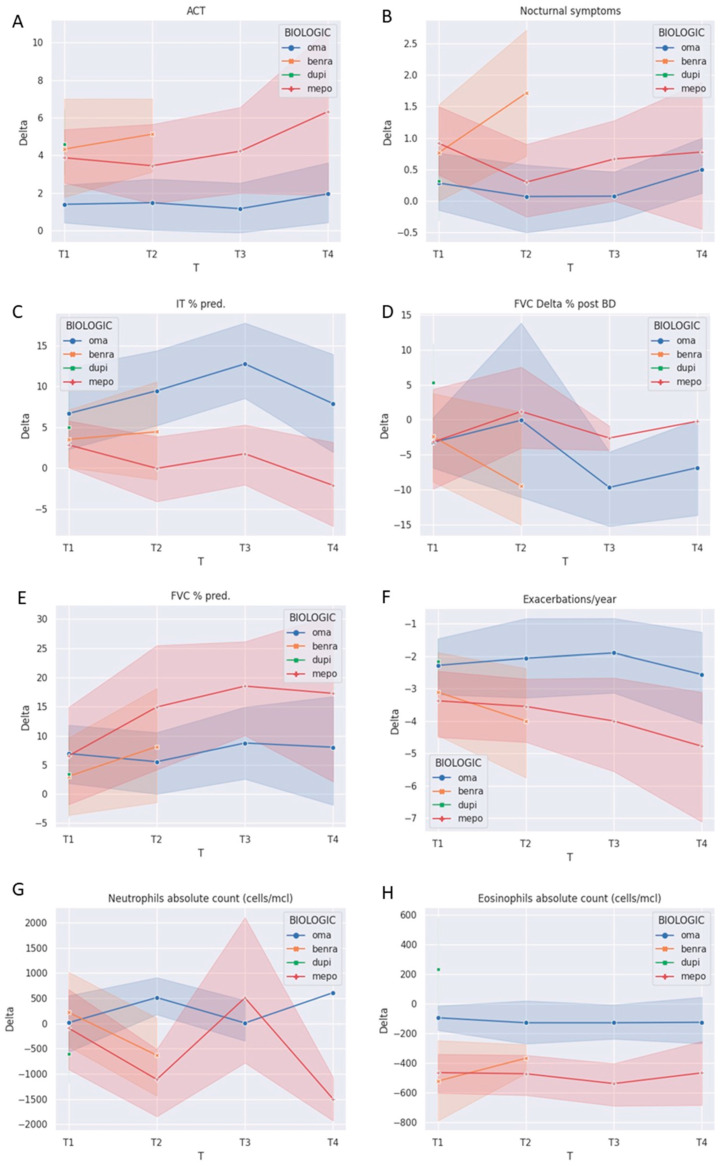
Figure 1.
Solid lines represent the trend of mean paired Delta values calculated from each time point towards T0. Shaded areas cover 95% IC. (A) ACT: asthma control test, (B) nocturnal symptoms, (C) TI % pred.: Tiffeneau index, (D) FVC Delta % post BD, (E) FVC% pred., (F) exacerbations/year, (G) neutrophils, and (H) eosinophils absolute count.

