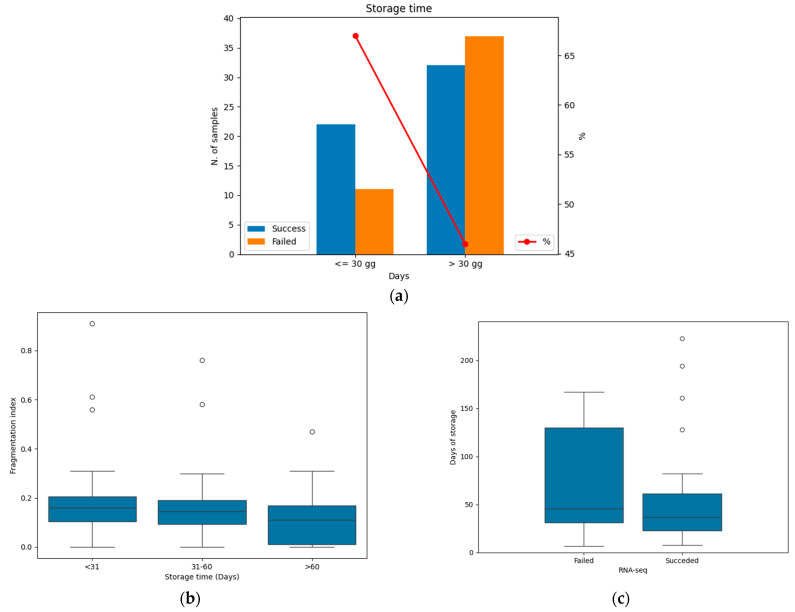
Figure 2.
Relationship between storage time and RNA-seq success rate (SR). (a) Successful and failed RNA-seq tests before and after 30 days. The red line represents the SR in the two groups. Blue: successful samples; orange: failed samples. (b) Box plot representing the decrease in RNA fragmentation index over time. (c) Box plot representing the distribution of successful and failed RNA-seq tests depending on storage time. Black bars within the boxes indicate the median value.

