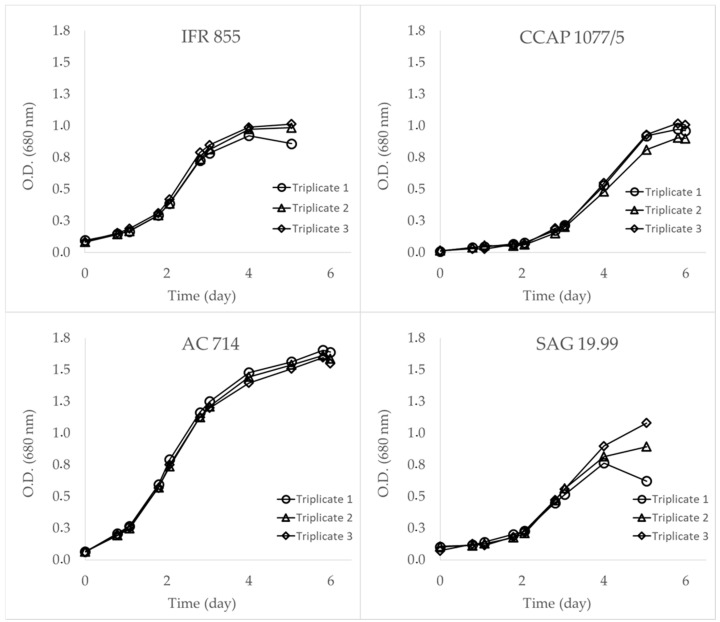
Figure 14.
Growth curves illustrating the growth dynamics of the four distinct strains of Skeletonema marinoi over time. Biomass was monitored using optical density (O.D.) at 680 nm. The variations in growth patterns among the strains are depicted, showcasing differences in growth rates, and maximal O.D. at the stationary phase. Biomass was sampled at the beginning of the stationary phase for pigment analysis (Van Heukelem method) and dry mass determination after freeze-drying.

