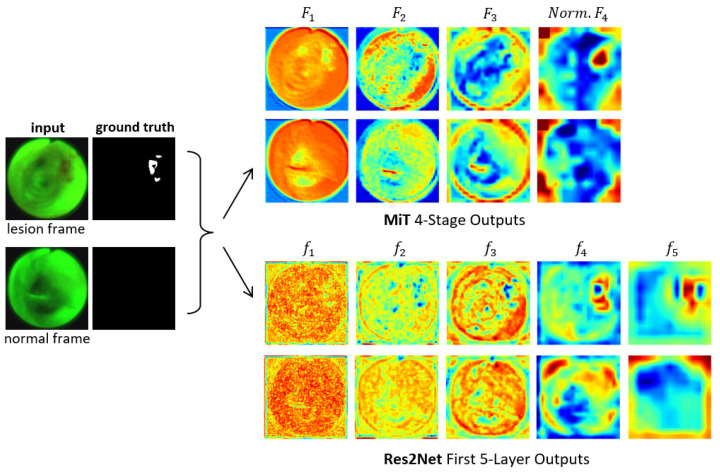
Figure 3.
Attention heat maps of feature flow through two encoders for two example AFB video frames. Frames #1722 and #4182 representing lesion and normal frames, respectively, from patient case 21405-184 are considered. The “ground truth” frames denote ground truth segmented images . The top two output rows are for the MiT-B2 encoder (Figure 1). For each feature tensor , the corresponding heat map’s value at a given location equals the average of the computed features. For better visualization, the heat maps display the quantity ; also, ’s output is normalized. The bottom two output rows are for the Res2Net encoder as used, for example, by CaraNet [19].

