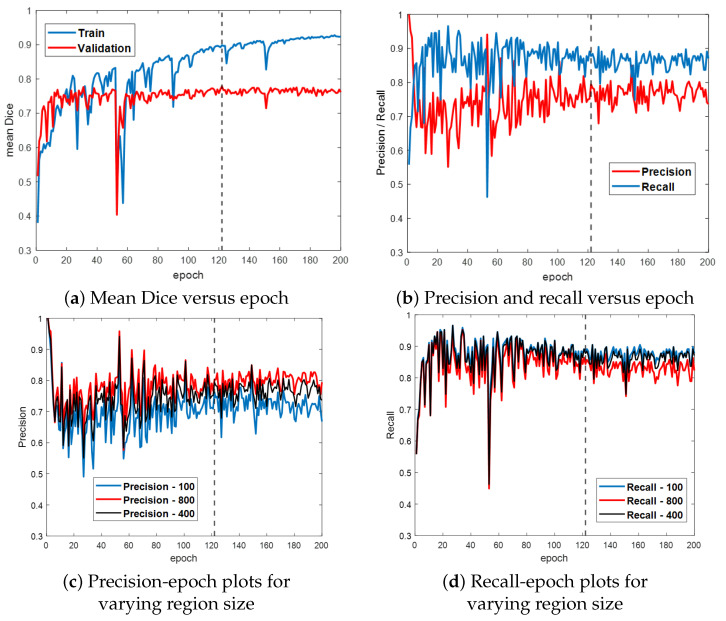
Figure 6.
Training and validation results for ESFPNet-S. Part (a) plots the mean Dice index versus epoch for the training and validation data. Part (b) illustrates precision and recall performance versus epoch for the validation data. Parts (c,d) illustrate the impact of varying the size of a significant region on precision and recall performance. The dashed line indicates where our best model was selected at this epoch based on its performance on the validation data.

