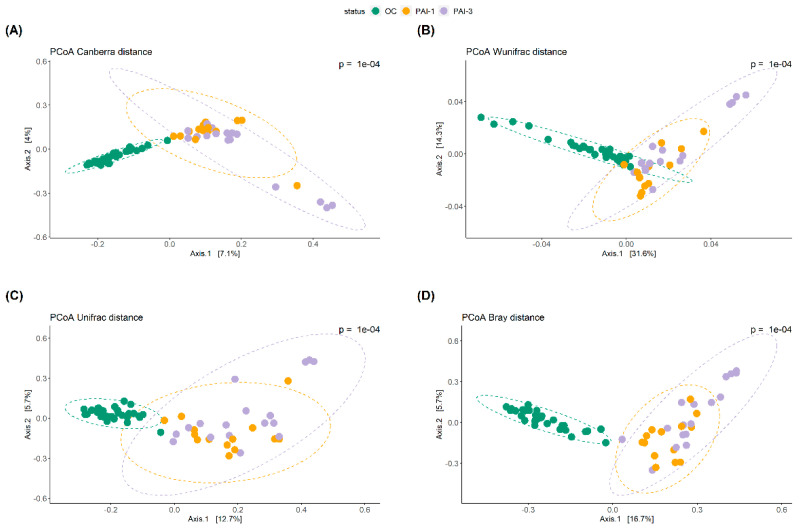
Figure 2.
Principal Coordinate Analysis (PCoA) plots are used for (A) Canberra, (B) Weighted Unifrac (Wunifrac), (C) Unifrac and (D) Bray–Curtis (Bray) metrics. Each dot represents an individual sample. PCoA plots show dimensions with the highest differences and normal confidence ellipsoids for the sample sets. Green: OC, orange: PAI-1 and violet: PAI-3.

