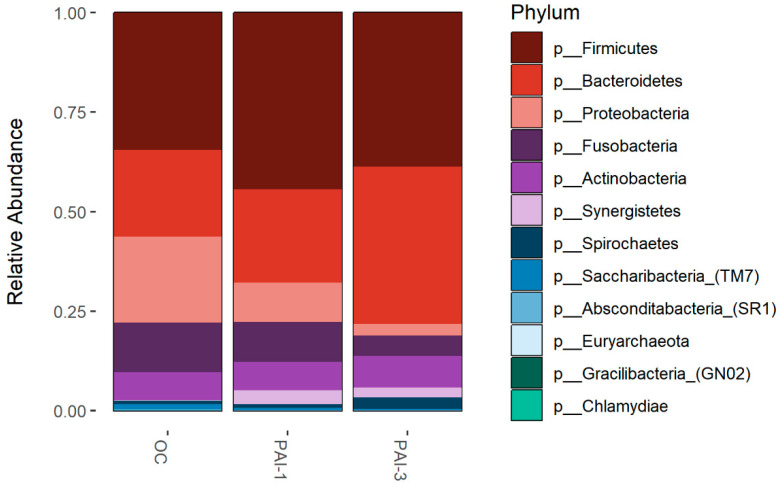
Figure 3.
Bar-plots of relative abundance at phylum level, identified in oral microbiota of the OC, PAI-1 and PAI-3 groups. The x-axis represents groups and the y-axis the relative abundance presented as the proportion of the species in that group. Different colored bars are different species, and the length of the bar represents the size of the proportion of the species.

