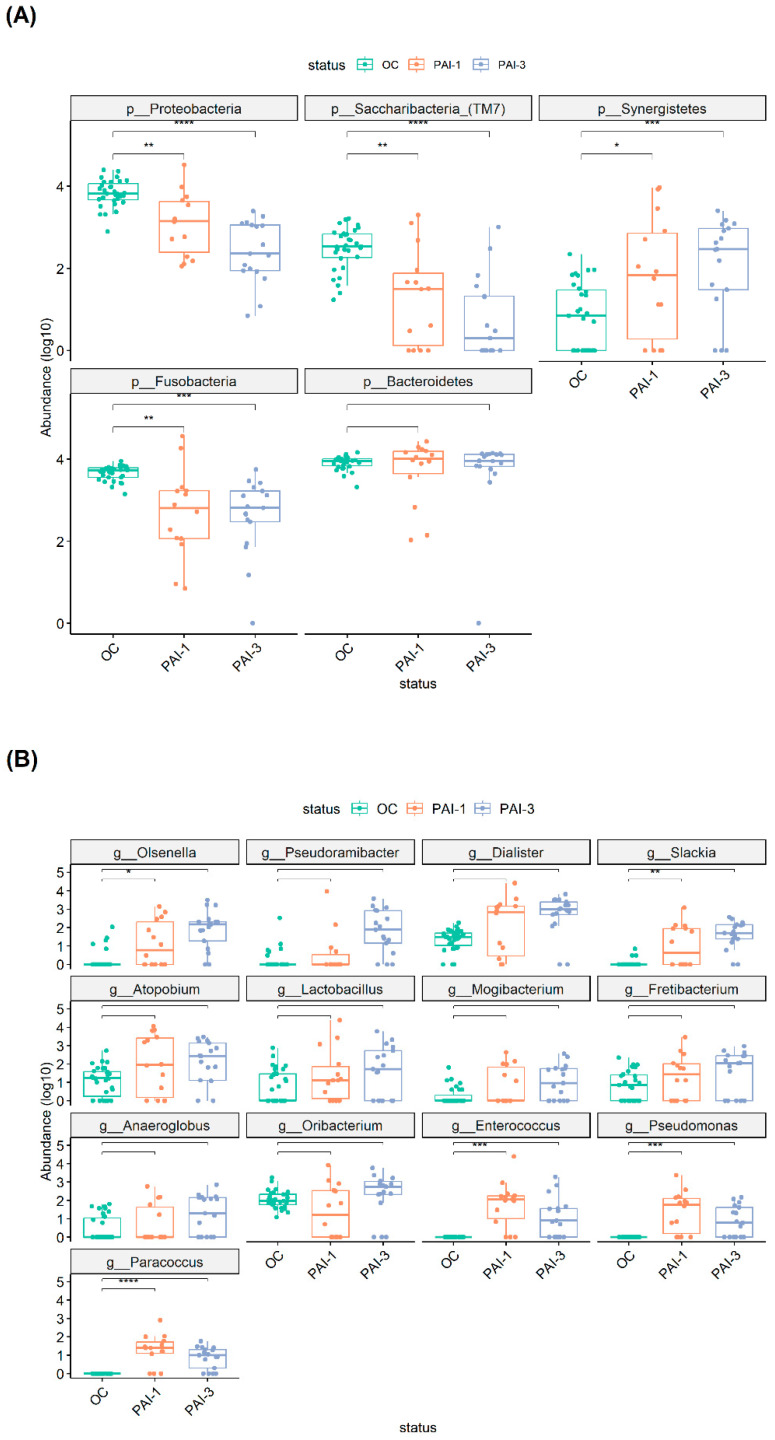
Figure 4.
Boxplots representing the differential abundant phyla (A) and genera (B), among the OC, PAI-1 and PAI-3 groups. The relative abundance is plotted in log10 on the y-axis. Asterix indicates statistically significant comparisons. (* p < 0.05, ** p < 0.01, *** p < 0.001, **** p < 0.0001). Green: OC, orange: PAI-1 and violet: PAI-3.

