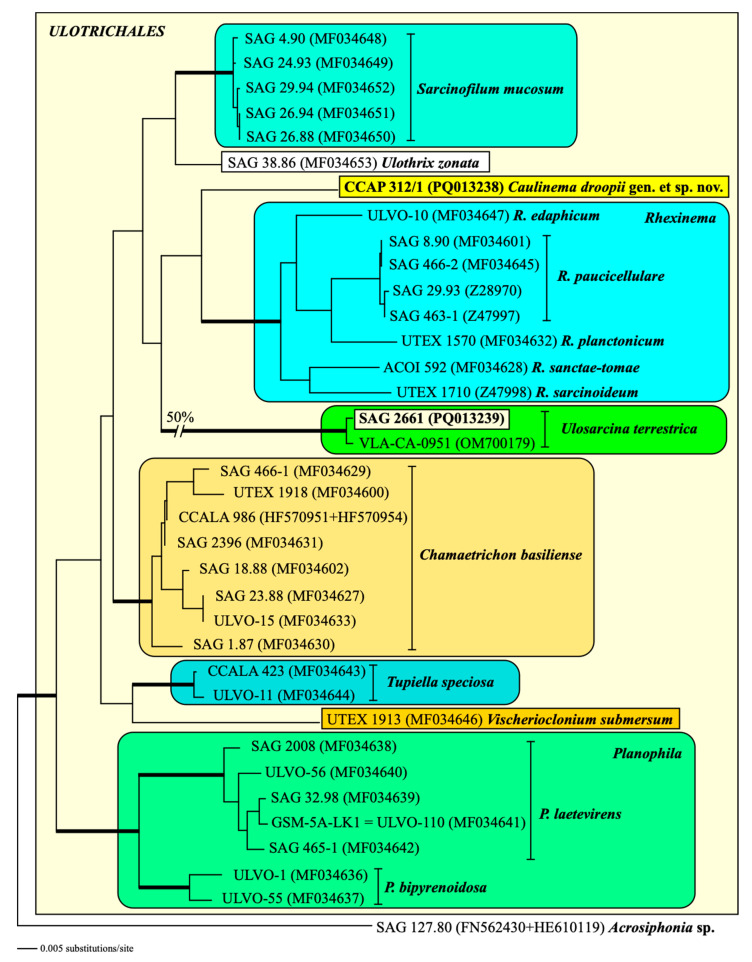
Figure 4.
Molecular phylogeny of the Ulotrichales based on SSU and ITS rDNA sequence comparisons. The phylogenetic tree shown was inferred using the maximum likelihood method based on the datasets (2354 aligned positions of 36 taxa) using PAUP 4.0a build169. For the analyses, the best model was calculated by the automated model selection tool implemented in PAUP. The setting of the best model was given as follows: SYM + I + G (base frequencies: equal; rate matrix A-C 1.2047; A-G 2.7302; A-U 1.4807; C-G 0.6519; C-U 5.6806; G-U 1.0000) with the proportion of invariable sites (I = 0.7257) and gamma shape parameter (G = 0.4521). The branches in bold are highly supported in all analyses (Bayesian values >0.95 calculated with PHASE and MrBayes; bootstrap values >70% calculated with PAUP using maximum likelihood, neighbor joining, maximum parsimony, and RAxML using maximum likelihood). The newly sequenced strains are highlighted in bold.

