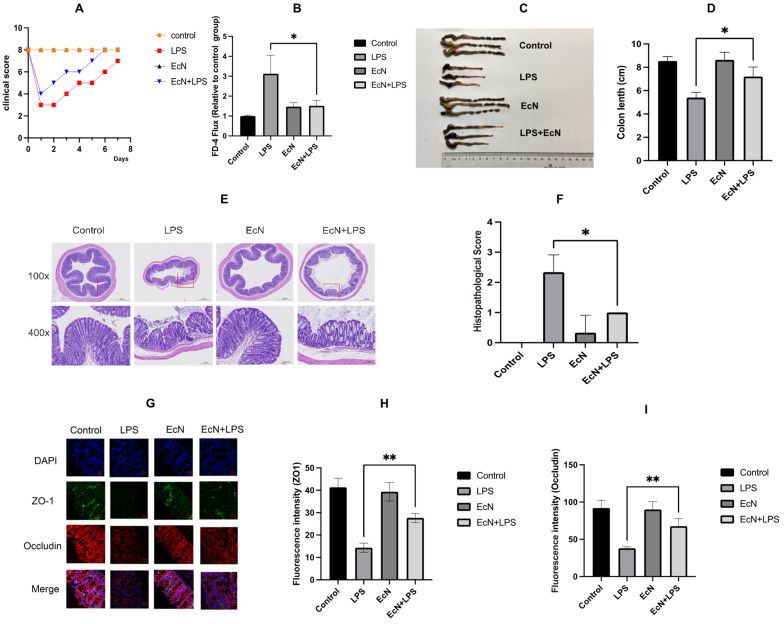
Figure 2.
(A) The clinical status score after modeling. (B) Plasma FITC-dextran 4000 Da (FD-4) concentration. (C,D) Macroscopic pictures of the colon. (E,F) H&E staining of the colon. (G–I) Immunofluorescence of tight junction proteins. DAPI (blue), ZO-1 (green), Occludin (red). Control, control group; LPS, LPS group; EcN, EcN group; EcN + LPS, EcN + LPS group. All data are shown as mean ± SEM (n = 3 for each group). * p < 0.05, ** p < 0.01, LPS versus EcN + LPS.

