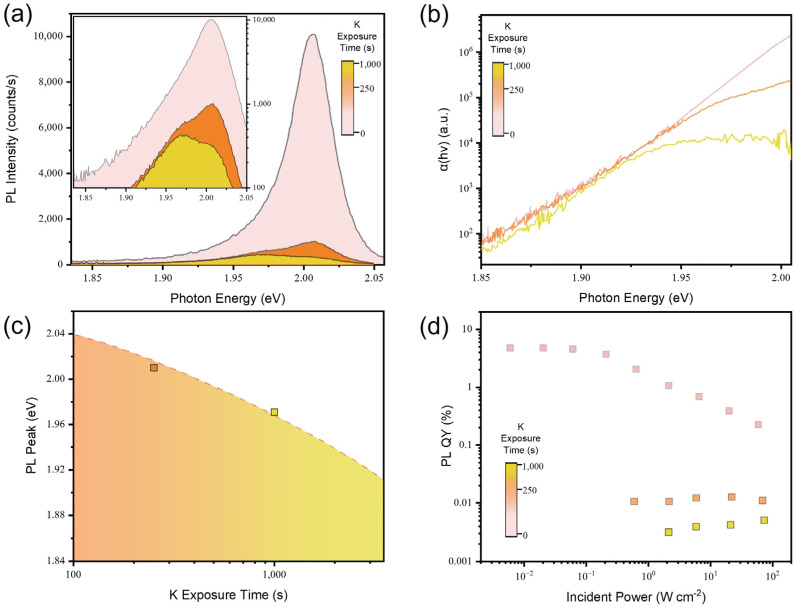
Figure 5.
(a) PL spectra of the WS2 monolayer measured at an incident power of 60 W/cm2 with increasing K exposure time. (b) The Urbach tail of WS2 monolayer as a function of K exposure time. (c) The relationship between PL peak position and K exposure time. (d) Incident power-dependent PL QY of the WS2 monolayer with increasing K exposure time.

