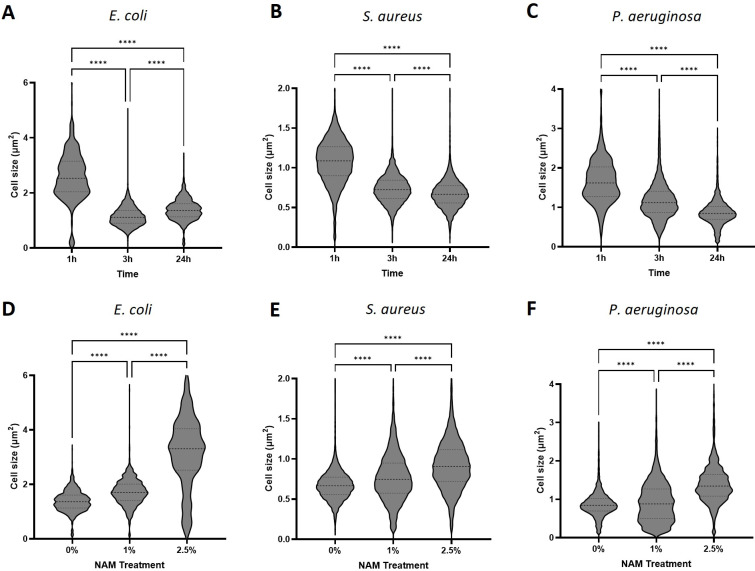
Figure 3.
Bacterial cell size analysis from microscopic phase images. Control treatment of microorganisms incubated in TSB medium of (A) E. coli, (B) S. aureus and (C) P. aeruginosa. Niacinamide treatment at concentrations of 0, 1 and 2.5% following 24 h incubation of (D) E. coli, (E) S. aureus and (F) P. aeruginosa. Corresponding phase images are located in Supplementary Figures S2–S5. (**** = p value < 0.0001).

